
Data Storytelling code
This is code accompanying an article about Data Storytelling in the German IT magazine iX 1/2022. The figures in this article were created as follows.
Note: Because the data is partly from a German source, the data description is in German as well.

iX 1/2022
library(readr)
library(tidyverse)
library(stringr)
library(lubridate)
Set colorblind-friendly palette
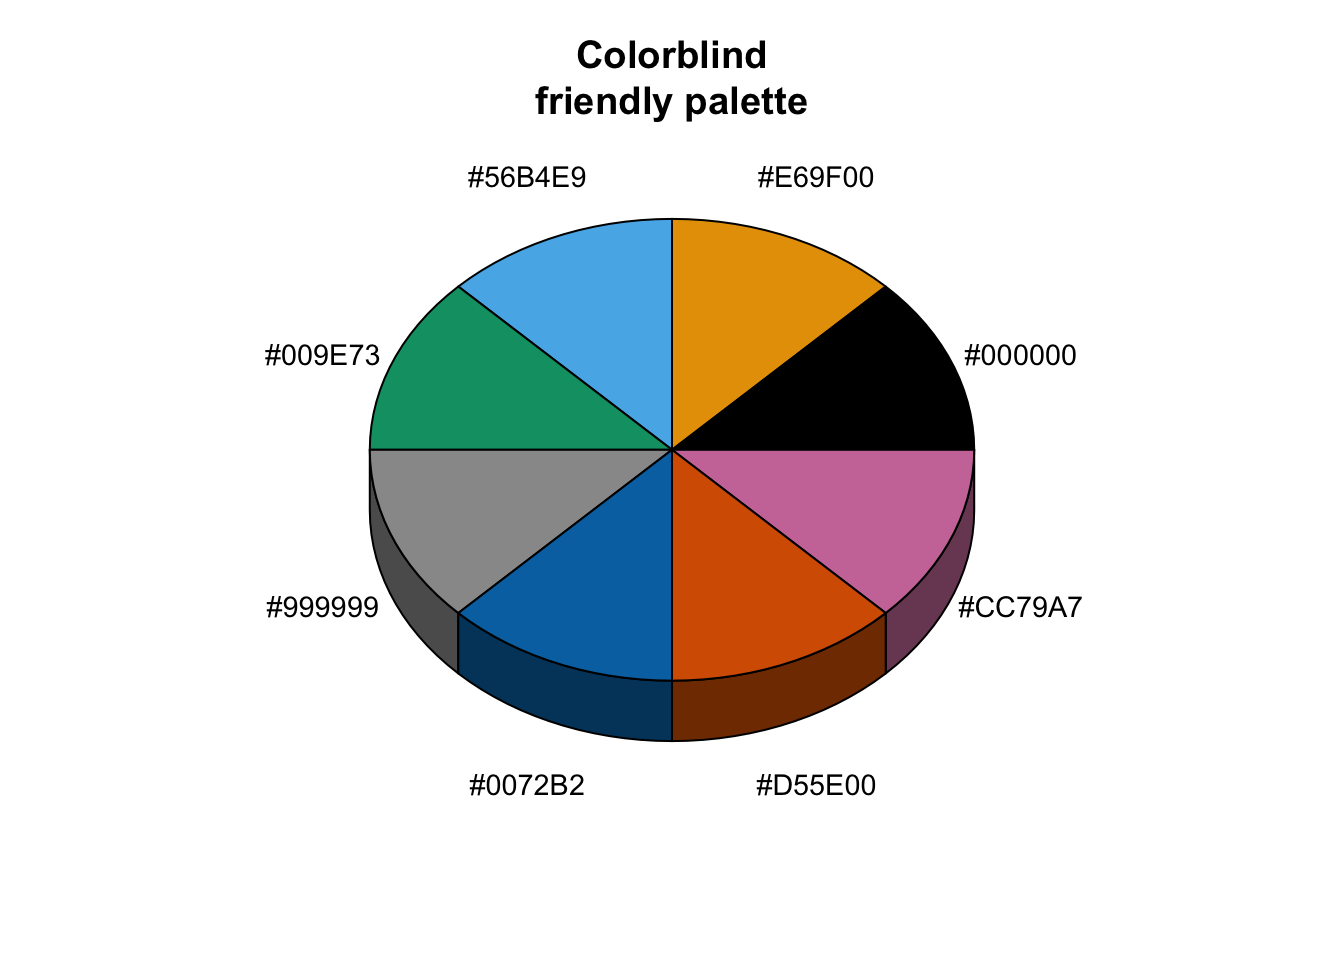
cbp2 <- c("#000000", "#E69F00", "#56B4E9", "#009E73",
          "#999999", "#0072B2", "#D55E00", "#CC79A7")

ggplot <- function(...) ggplot2::ggplot(...) +
  scale_color_manual(values = cbp2) +
  scale_fill_manual(values = cbp2) + # note: needs to be overridden when using continuous color scales
  theme_bw()
library(plotrix)
sliceValues <- rep(10, 8) # each slice value=10 for proportionate slices
(
p <- pie3D(sliceValues,
explode=0,
theta = 1.2,
col = cbp2,
labels = cbp2,
labelcex = 0.9,
shade = 0.6,
main = "Colorblind\nfriendly palette")
)
## [1] 0.3926991 1.1780972 1.9634954 2.7488936 3.5342917 4.3196899 5.1050881
## [8] 5.8904862
Data
RKI
Because the original data file is in Excel (.xlsx) format, I exported worksheets with data of interest as .csv. Alternatively, you could use the xlsx package to directly read in .xlsx files.
You can directly download the csv files I used from Github.
file_fz <- "fallzahlen.csv"
file_sti <- "siebentageinzidenz.csv"

data_fz <- read_csv2(paste0("/Users/shiringlander/Documents/Github/data_storytelling_ix2021/data/", file_fz)) %>%
  gather("jahr_woche", "fallzahl", -Altersgruppe)

data_fz_sti <- read_csv2(paste0("/Users/shiringlander/Documents/Github/data_storytelling_ix2021/data/", file_sti)) %>%
  gather("jahr_woche", "siebentageinzidenz", -Altersgruppe) %>%
  full_join(data_fz, by = c("Altersgruppe", "jahr_woche")) %>%
  mutate(Jahr = as.numeric(str_extract(jahr_woche, "^.*(?=(_))")),
         Woche = as.numeric(str_remove(jahr_woche, "^(.*?_)")),
         fallzahl = as.numeric(fallzahl)) %>%
  mutate(Datum = paste0(Jahr, "-W", Woche, "-1"),
         Datum = make_datetime(year = Jahr) + weeks(Woche)) %>%
  select(-jahr_woche) %>%
  select(Datum, Jahr, Woche, Altersgruppe, everything()) %>%
  gather("x", "y", siebentageinzidenz:fallzahl)

data_fz_sti %>%
  head()
## # A tibble: 6 × 6
## Datum Jahr Woche Altersgruppe x y
## <dttm> <dbl> <dbl> <chr> <chr> <dbl>
## 1 2020-03-11 00:00:00 2020 10 Gesamt siebentageinzidenz 1.08
## 2 2020-03-11 00:00:00 2020 10 90 siebentageinzidenz 0.12
## 3 2020-03-11 00:00:00 2020 10 85 - 89 siebentageinzidenz 0.38
## 4 2020-03-11 00:00:00 2020 10 80 - 84 siebentageinzidenz 0.36
## 5 2020-03-11 00:00:00 2020 10 75 - 79 siebentageinzidenz 0.62
## 6 2020-03-11 00:00:00 2020 10 70 - 74 siebentageinzidenz 0.3Stand: 08.09.2021 07:09:21
Die dem RKI übermittelten COVID-19-Fälle nach Meldewoche und Geschlecht sowie Anteile mit für COVID-19 relevanten Symptomen, Anteile Hospitalisierter und Verstorbener für die Meldewochen KW 10 – 53/2020 und KW 01 - 35/2021
Altersmedian/-mittelwert für Hospitalisierte, Patienten auf Intensivstation und Verstorbene von an das RKI übermittelten COVID-19-Fällen für die Meldewochen KW 10 – 53/2020 und KW 01 - 35/2021
file_ka <- "klinische_aspekte.csv"
file_am <- "altersmedian.csv"

data_ka <- read_csv2(paste0("/Users/shiringlander/Documents/Github/data_storytelling_ix2021/data/", file_ka))
data_am <- read_delim(paste0("/Users/shiringlander/Documents/Github/data_storytelling_ix2021/data/", file_am), delim = ";", locale = locale(decimal_mark = ".")) %>%
  select(-'Fälle gesamt') %>%
  full_join(data_ka, by = c("Meldejahr", "Meldewoche" = "MW")) %>%
  mutate(Datum = paste0(Meldejahr, "-W", Meldewoche, "-1"),
         Datum = make_datetime(year = Meldejahr) + weeks(Meldewoche)) %>%
  select(-'Anteil keine, bzw. keine für COVID-19 bedeutsamen Symptome',
         -'Anteil der Hospitalisierten bei Fällen mit Angabe zur Hospitalisation') %>%
  select(Datum, Meldejahr, Meldewoche, everything()) %>%
  mutate(Männer = as.numeric(gsub("[^0-9.]", "",  Männer)),
         Frauen = as.numeric(gsub("[^0-9.]", "",  Frauen)),
         `Anteil Verstorben` = gsub(",", ".", `Anteil Verstorben`),
         `Anteil Verstorben` = as.numeric(gsub("[^0-9.]", "",  `Anteil Verstorben`))) %>%
  gather("x", "y", Alle_Altersmedian:'Anteil Verstorben') %>%
  rename(Jahr = Meldejahr, Woche = Meldewoche)

data_am %>%
  head()
## # A tibble: 6 × 5
## Datum Jahr Woche x y
## <dttm> <dbl> <dbl> <chr> <dbl>
## 1 2020-03-11 00:00:00 2020 10 Alle_Altersmedian 45
## 2 2020-03-18 00:00:00 2020 11 Alle_Altersmedian 47
## 3 2020-03-25 00:00:00 2020 12 Alle_Altersmedian 47
## 4 2020-04-01 00:00:00 2020 13 Alle_Altersmedian 49
## 5 2020-04-08 00:00:00 2020 14 Alle_Altersmedian 52
## 6 2020-04-15 00:00:00 2020 15 Alle_Altersmedian 52Vaccination data
file_vacc <- "vaccination_ger.csv"
data_vacc <- read_delim(paste0("/Users/shiringlander/Documents/Github/data_storytelling_ix2021/data/", file_vacc), delim = ",", locale = locale(decimal_mark = ".")) %>%
  gather("x", "y", total_vaccinations:daily_vaccinations_per_million) %>%
  select(-location, -iso_code)
Combination
data_gesamt <- data_fz_sti %>%
  filter(Altersgruppe == "Gesamt") %>%
  select(-Altersgruppe) %>%
  unique() %>%
  bind_rows(data_am) %>%
  select(-Jahr,-Woche) %>%
  rename(date = "Datum") %>%
  bind_rows(data_vacc)
Plots
data_gesamt %>%
  select(x) %>%
  filter(!duplicated(x))
## # A tibble: 30 × 1
## x
## <chr>
## 1 siebentageinzidenz
## 2 fallzahl
## 3 Alle_Altersmedian
## 4 Hosp_Altersmedian
## 5 ITS_Altersmedian
## 6 Verstorben_Altersmedian
## 7 Alle_MW_Alter
## 8 Hosp_MW_Alter
## 9 ITS_MW_Alter
## 10 Verst_MW_Alter
## # … with 20 more rowsdata_gesamt_perc_vacc <- data_gesamt %>%
filter(grepl("people_vaccinated$", x) | grepl("people_fully_vaccinated$", x)) %>%
mutate(y_perc = y / 83020000 * 100)first_vac <- data_gesamt_perc_vacc %>%
slice(1) %>%
mutate(label = "Erste Impfungen")
bigger_ten <- data_gesamt_perc_vacc %>%
group_by(x) %>%
filter(y_perc > 10) %>%
slice(1) %>%
mutate(label = "> 10%")
bigger_25 <- data_gesamt_perc_vacc %>%
group_by(x) %>%
filter(y_perc > 25) %>%
slice(1) %>%
mutate(label = "> 25%")
bigger_50 <- data_gesamt_perc_vacc %>%
group_by(x) %>%
filter(y_perc > 50) %>%
slice(1) %>%
mutate(label = "> 50%")
last_entry <- data_gesamt_perc_vacc %>%
group_by(x) %>%
top_n(1) %>%
mutate(label = paste0("letzter Eintrag ", round(y_perc, digits = 2), "%"))
vacc_data <- first_vac %>%
bind_rows(bigger_ten) %>%
bind_rows(bigger_25) %>%
bind_rows(bigger_50) %>%
bind_rows(last_entry) %>%
mutate(x = ifelse(x == "people_vaccinated", "Prozent Geimpft", "Prozent Zweitimpfung"))# Altersmedian & MW Alter
data_gesamt_prep <- data_gesamt %>%
filter(grepl("median", x) | grepl("MW", x)) %>%
mutate(stat = ifelse(grepl("median", x), "Median", "Mittelwert"),
x = gsub("_", " ", x),
x = gsub("Altersmedian|MW", "", x),
x = gsub("Alter", "", x),
x = gsub(" ", "", x),
x = gsub("Verst$", "Verstorben", x),
x = gsub("Verstorben", "Gestorben", x))data_gesamt <- data_gesamt %>%
mutate(date = as.Date(date, "%Y-%m-%d", tz = "CEST"))
data_gesamt_prep <- data_gesamt_prep %>%
mutate(date = as.Date(date, "%Y-%m-%d", tz = "CEST"))
vacc_data <- vacc_data %>%
mutate(date = as.Date(date, "%Y-%m-%d", tz = "CEST"))ggplot() +
geom_vline(data = vacc_data,
aes(xintercept = date, color = x)) +
geom_line(data = data_gesamt_prep,
aes(x = date, y = y, color = x, linetype = stat)) +
scale_x_date(date_breaks = "1 month",
date_minor_breaks = "1 week") +
ggrepel::geom_label_repel(data = vacc_data,
aes(x = date, y = 90, label = label, color = x),
arrow = arrow(length = unit(0.02, "npc"))) +
theme(legend.position="top") +
labs(x = "Datum",
y = "Alter in Jahren",
linetype = "Statistik",
color = "Einteilung der\nErkrankten/Geimpften",
title = "Unterscheiden sich das Durchschnittsalter aller an Covid-19 erkrankter von Hospitalisierten und Verstorbenen?\nUnd welchen Einfluss hat das Impfgeschehen darauf?",
#subtitle = "",
caption = "Datenquellen (Stand: 08.09.2021 07:09:21):
Robert-Koch-Institut: https://www.rki.de/DE/Content/InfAZ/N/Neuartiges_Coronavirus/Daten/Klinische_Aspekte.html &
https://ourworldindata.org/: https://raw.githubusercontent.com/owid/covid-19-data/master/public/data/vaccinations/vaccinations.csv")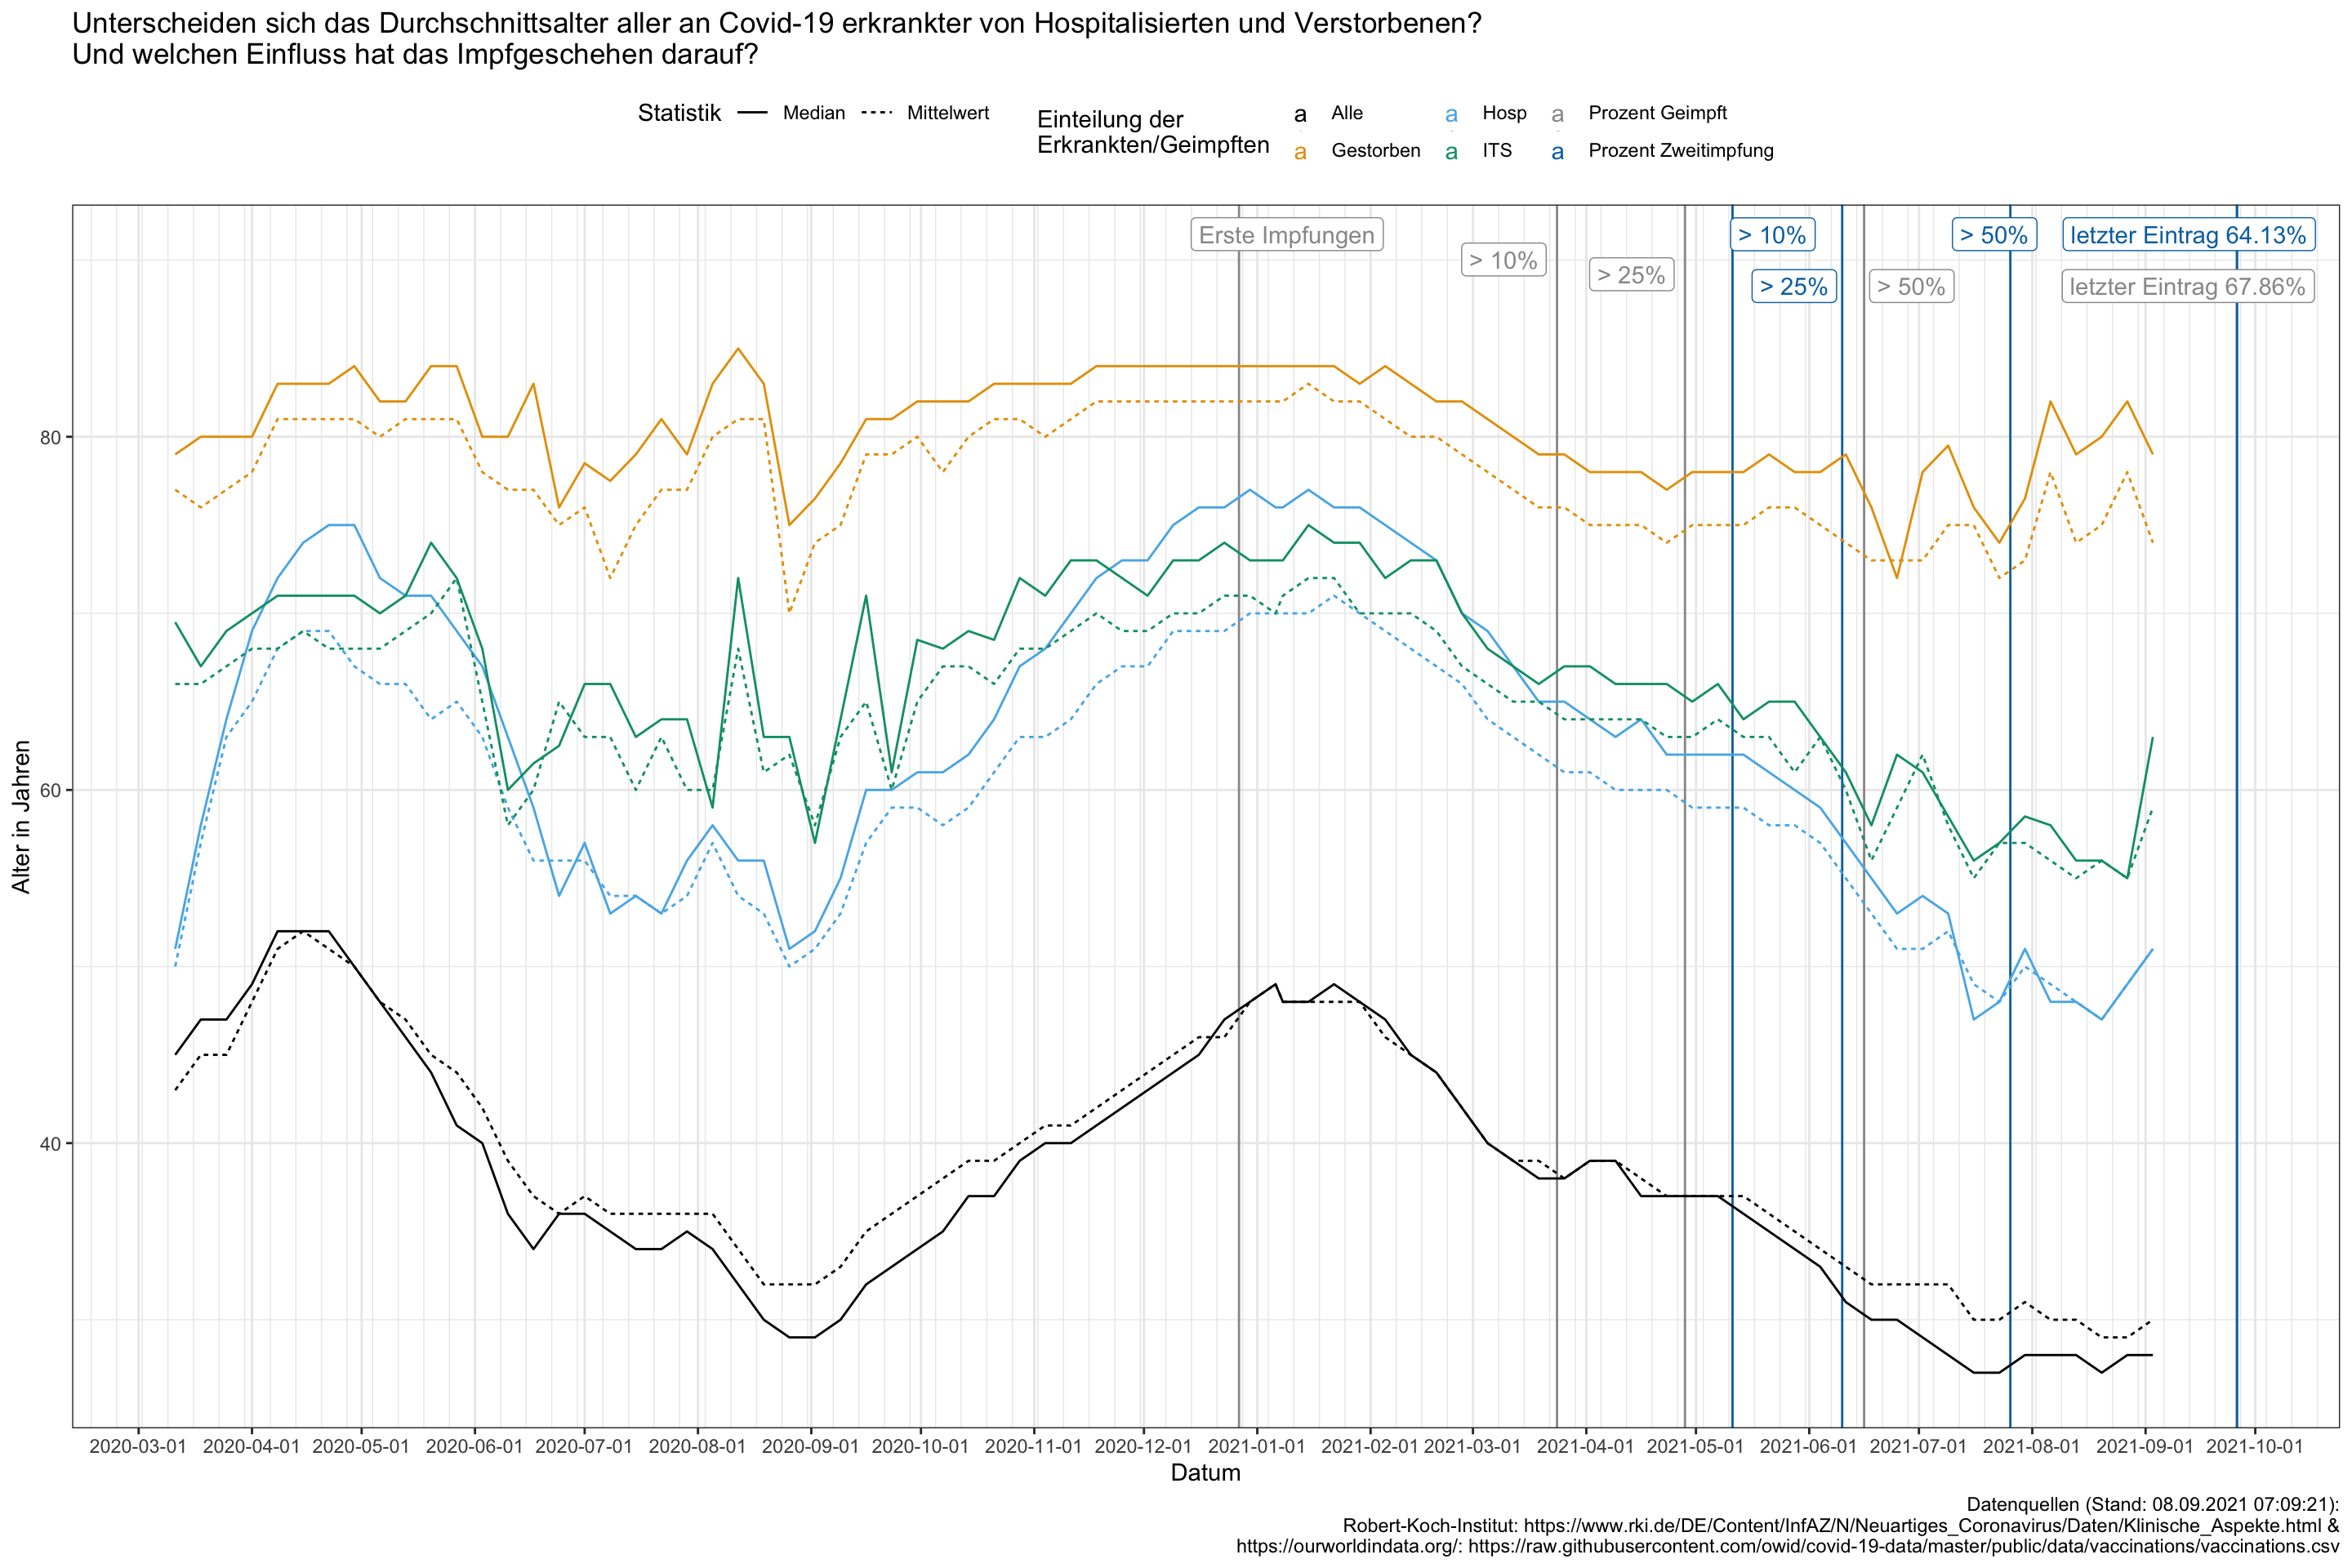
ggplot() +
  geom_vline(data = vacc_data %>% rename(xx = x), aes(xintercept = date, color = xx)) +
  geom_line(data = data_gesamt %>% filter(grepl("Fälle gesamt", x) | grepl("Anteil Verstorben", x)),
    aes(x = date, y = y, color = x)) +
  facet_wrap(x ~ ., scales = "free", nrow = 2,
                strip.position = "left",
                labeller = as_labeller(c('Fälle gesamt' = "Fälle gesamt", 'Anteil Verstorben' = "Anteil Verstorbener") ) ) +
  scale_x_date(date_breaks = "1 month",
               date_minor_breaks = "1 week") +
  ggrepel::geom_label_repel(data = vacc_data %>% rename(xx = x),
             aes(x = date, y = 7, label = label, color = xx),
             arrow = arrow(length = unit(0.02, "npc"))) +
  theme(legend.position="top") +
  labs(x = "Datum",
       y = "",
       color = "",
        title = "Hat das Impfgeschehen Einfluss auf die Fallzahlen?",
        #subtitle = "",
        caption = "Datenquellen (Stand: 08.09.2021 07:09:21):
       Robert-Koch-Institut: https://www.rki.de/DE/Content/InfAZ/N/Neuartiges_Coronavirus/Daten/Klinische_Aspekte.html &
       https://ourworldindata.org/: https://raw.githubusercontent.com/owid/covid-19-data/master/public/data/vaccinations/vaccinations.csv")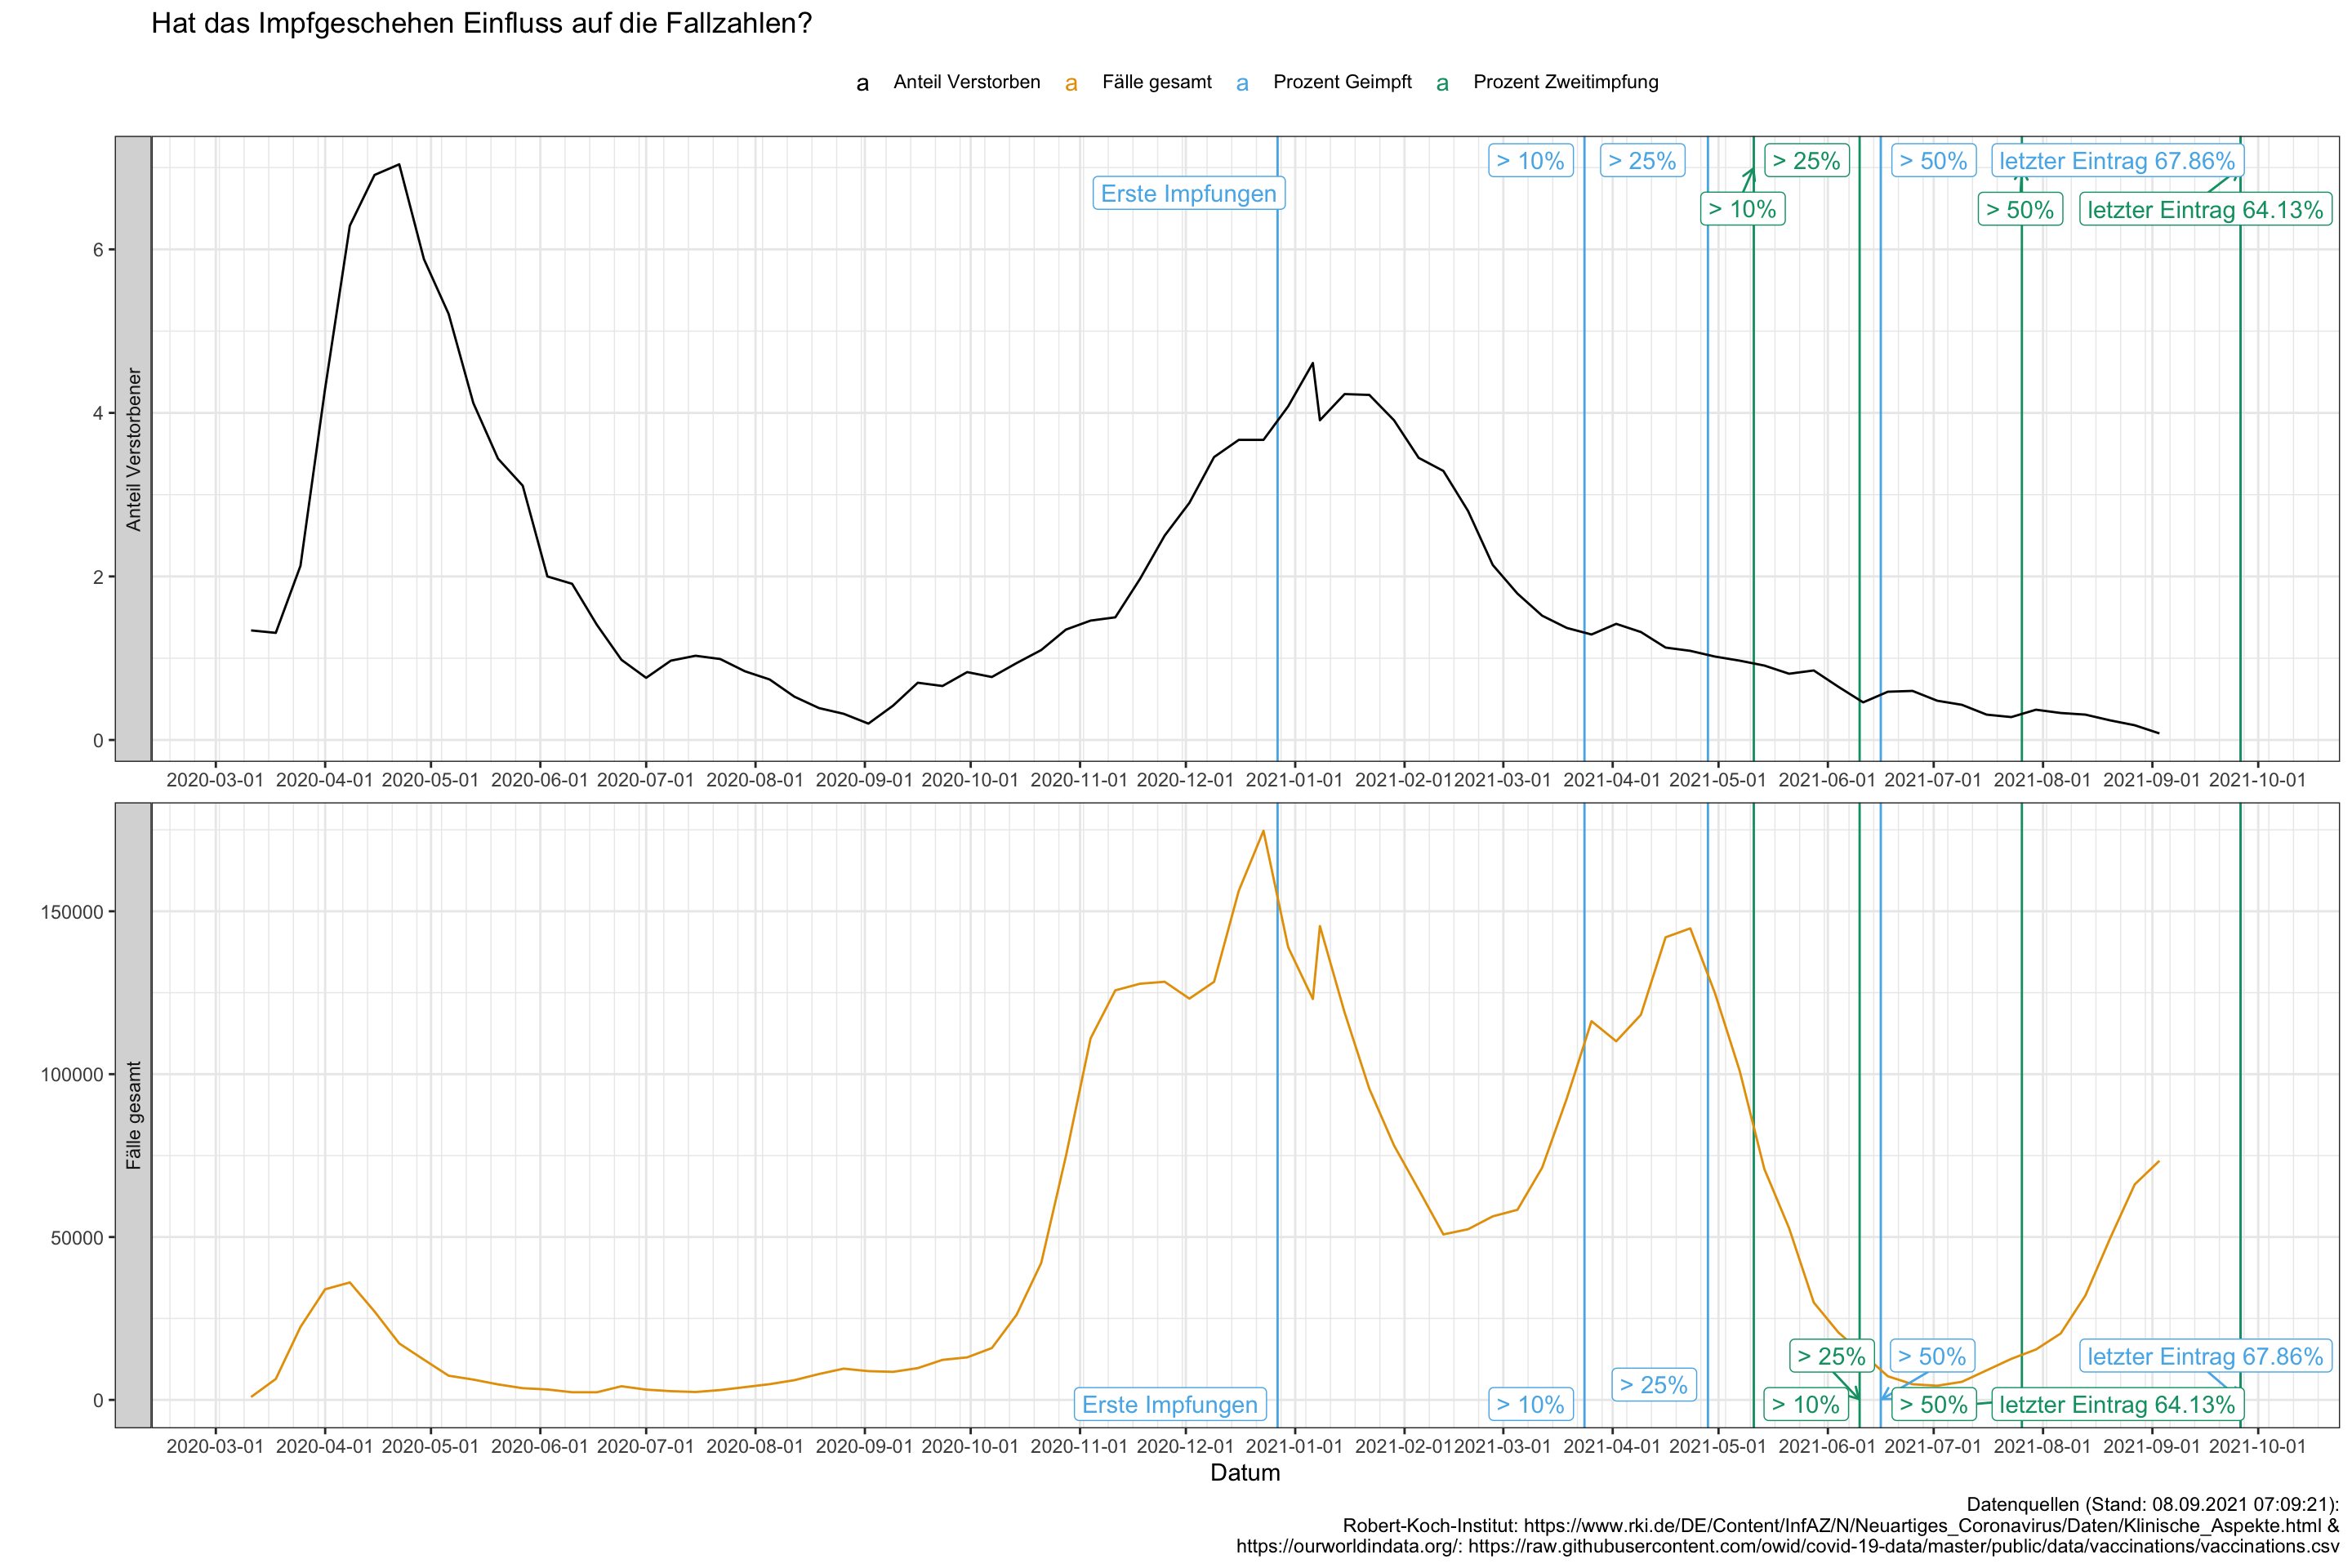
ggplot() +
  geom_vline(data = vacc_data %>% rename(xx = x), aes(xintercept = date, color = xx)) +
  geom_line(data = data_gesamt %>% filter(grepl("Frauen", x)),
    aes(x = date, y = y, color = x)) +
  scale_x_date(date_breaks = "1 month",
               date_minor_breaks = "1 week") +
  ggrepel::geom_label_repel(data = vacc_data %>% rename(xx = x),
             aes(x = date, y = 56, label = label, color = xx),
             arrow = arrow(length = unit(0.02, "npc"))) +
  theme(legend.position="top") +
  labs(x = "Datum",
       y = "Prozentanteil weiblicher Infektionsfälle",
       color = "",
        title = "Hat das Impfgeschehen Einfluss auf den Anteil von infizierten Männern und Frauen?",
        #subtitle = "",
        caption = "Datenquellen (Stand: 08.09.2021 07:09:21):
       Robert-Koch-Institut: https://www.rki.de/DE/Content/InfAZ/N/Neuartiges_Coronavirus/Daten/Klinische_Aspekte.html &
       https://ourworldindata.org/: https://raw.githubusercontent.com/owid/covid-19-data/master/public/data/vaccinations/vaccinations.csv")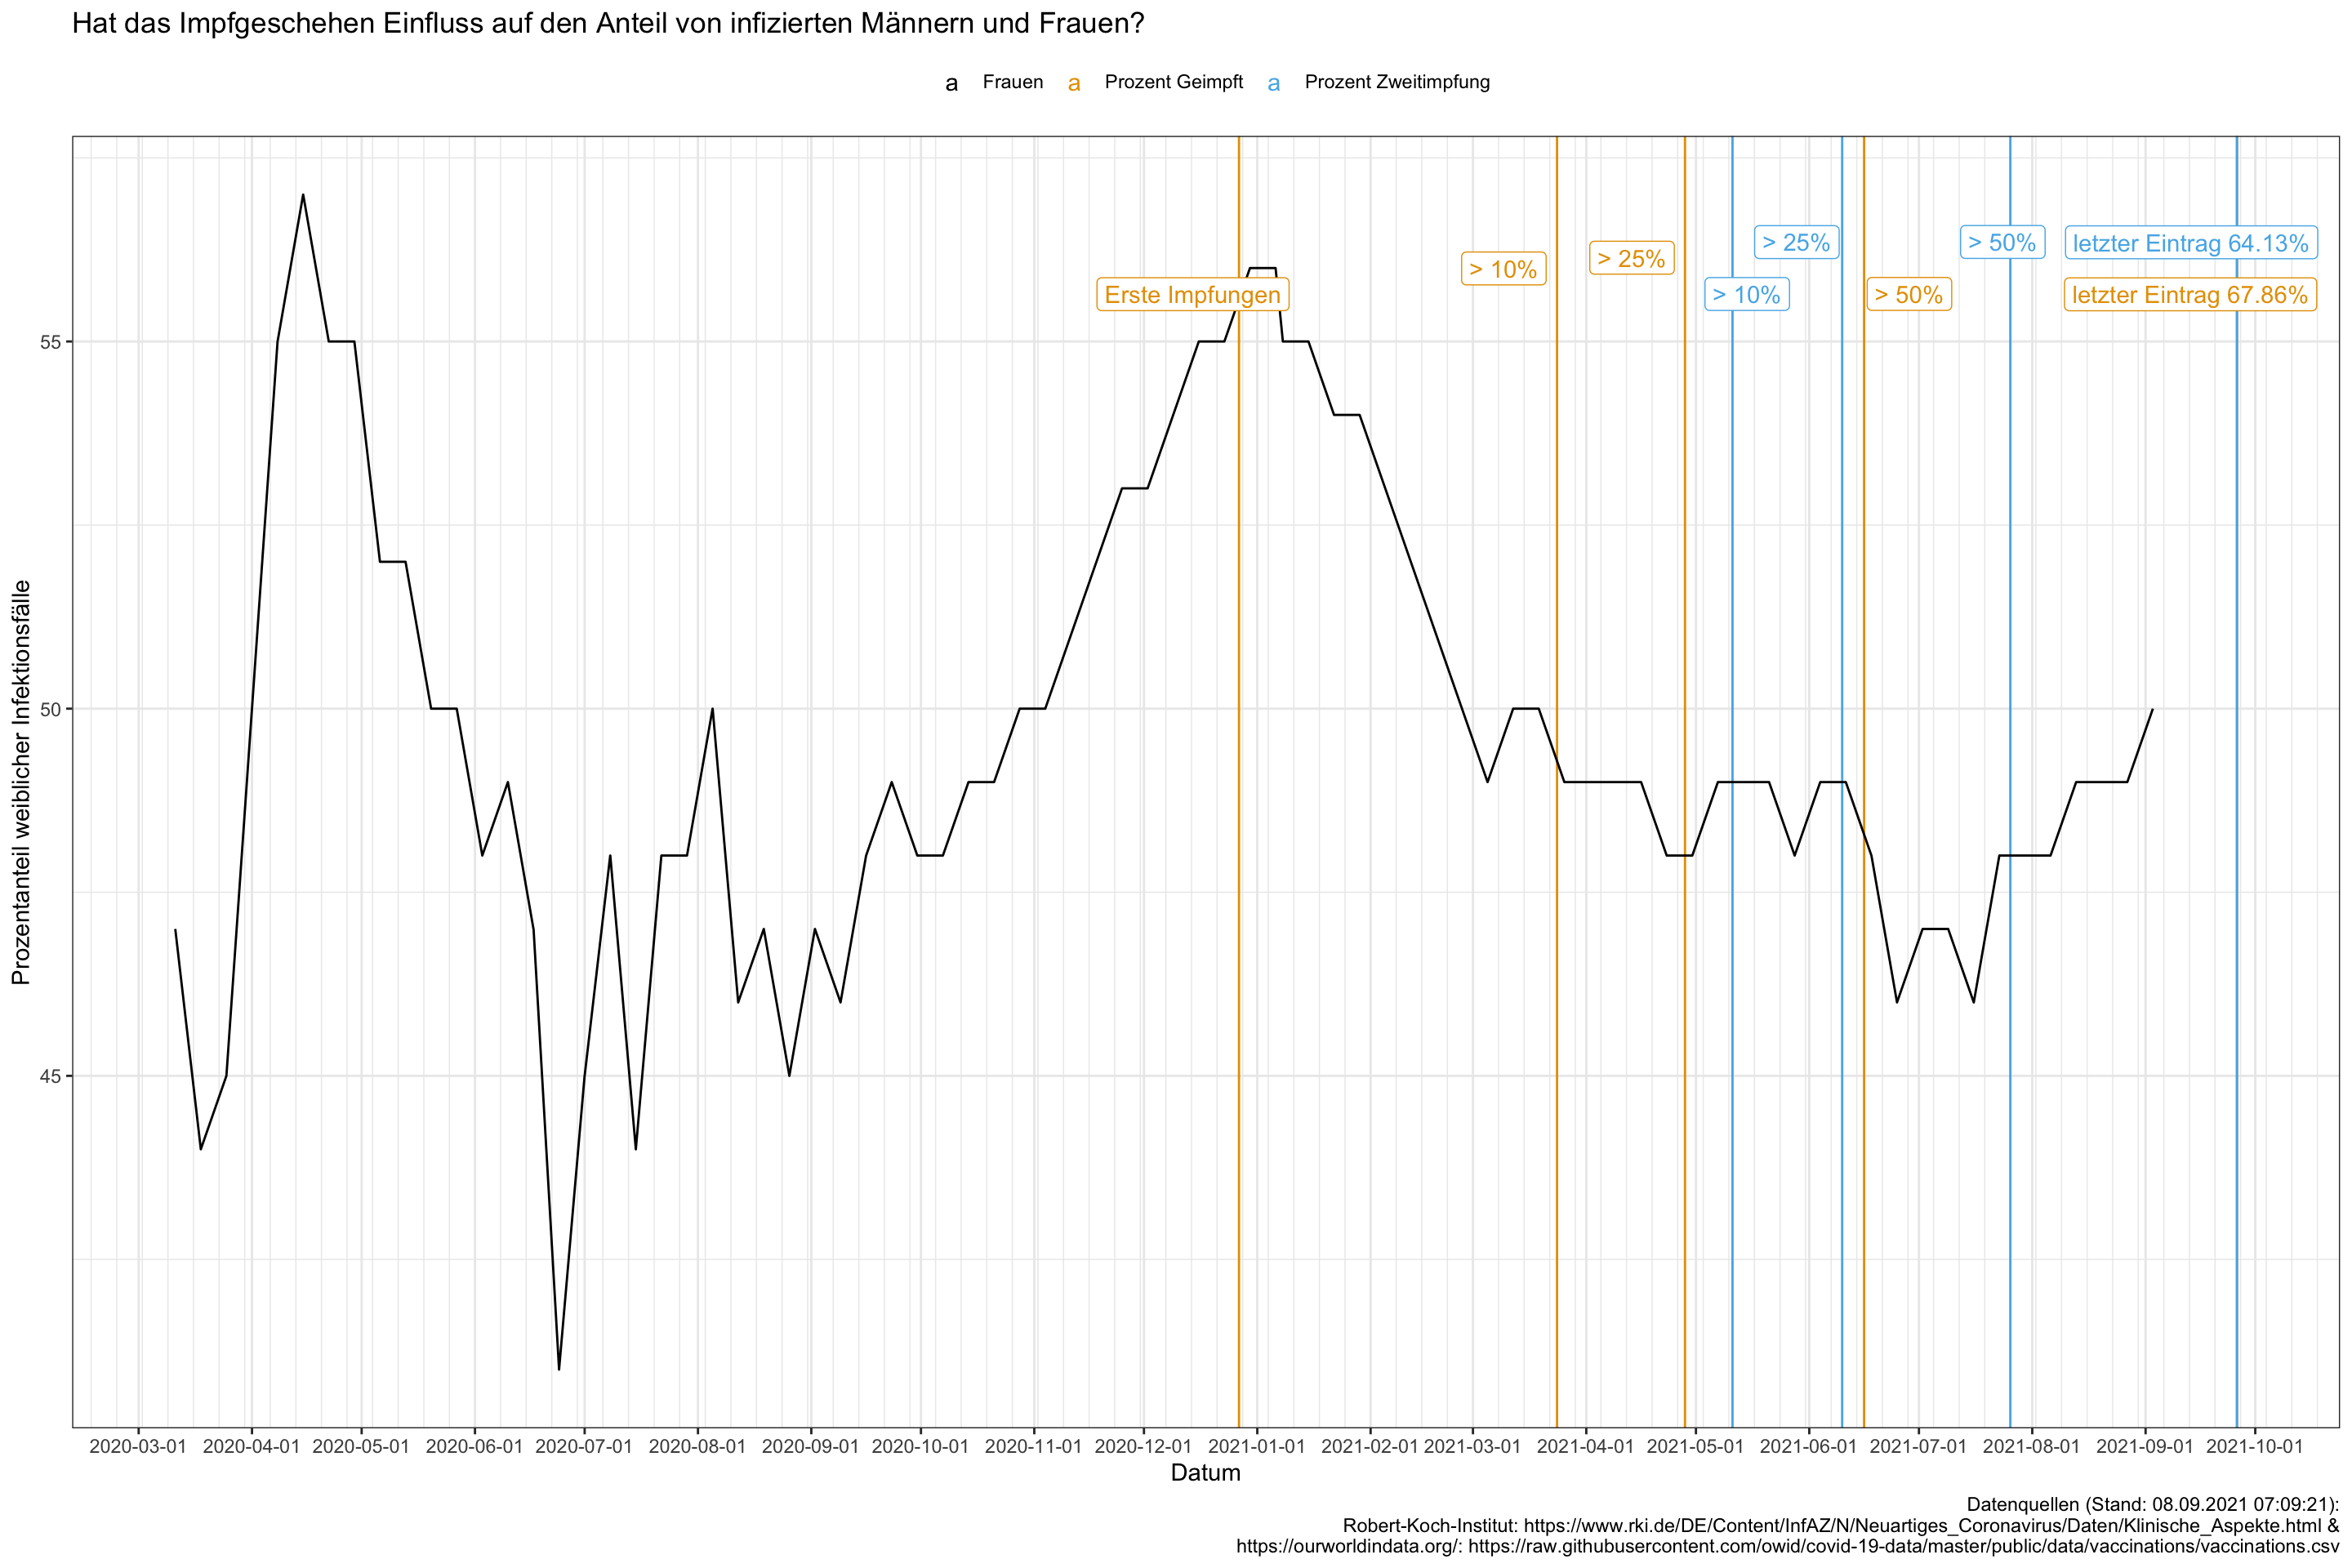
devtools::session_info()## ─ Session info ───────────────────────────────────────────────────────────────
## setting value
## version R version 4.1.1 (2021-08-10)
## os macOS Big Sur 10.16
## system x86_64, darwin17.0
## ui X11
## language (EN)
## collate en_US.UTF-8
## ctype en_US.UTF-8
## tz Europe/Berlin
## date 2022-01-10
##
## ─ Packages ───────────────────────────────────────────────────────────────────
## package * version date lib source
## assertthat 0.2.1 2019-03-21 [1] CRAN (R 4.1.0)
## backports 1.2.1 2020-12-09 [1] CRAN (R 4.1.0)
## bit 4.0.4 2020-08-04 [1] CRAN (R 4.1.0)
## bit64 4.0.5 2020-08-30 [1] CRAN (R 4.1.0)
## blogdown 1.5 2021-09-02 [1] CRAN (R 4.1.0)
## bookdown 0.24 2021-09-02 [1] CRAN (R 4.1.0)
## broom 0.7.9 2021-07-27 [1] CRAN (R 4.1.0)
## bslib 0.3.0 2021-09-02 [1] CRAN (R 4.1.0)
## cachem 1.0.6 2021-08-19 [1] CRAN (R 4.1.0)
## callr 3.7.0 2021-04-20 [1] CRAN (R 4.1.0)
## cellranger 1.1.0 2016-07-27 [1] CRAN (R 4.1.0)
## cli 3.0.1 2021-07-17 [1] CRAN (R 4.1.0)
## colorspace 2.0-2 2021-06-24 [1] CRAN (R 4.1.0)
## crayon 1.4.1 2021-02-08 [1] CRAN (R 4.1.0)
## DBI 1.1.1 2021-01-15 [1] CRAN (R 4.1.0)
## dbplyr 2.1.1 2021-04-06 [1] CRAN (R 4.1.0)
## desc 1.3.0 2021-03-05 [1] CRAN (R 4.1.0)
## devtools 2.4.2 2021-06-07 [1] CRAN (R 4.1.0)
## digest 0.6.28 2021-09-23 [1] CRAN (R 4.1.1)
## dplyr * 1.0.7 2021-06-18 [1] CRAN (R 4.1.0)
## ellipsis 0.3.2 2021-04-29 [1] CRAN (R 4.1.0)
## evaluate 0.14 2019-05-28 [1] CRAN (R 4.1.0)
## fansi 0.5.0 2021-05-25 [1] CRAN (R 4.1.0)
## farver 2.1.0 2021-02-28 [1] CRAN (R 4.1.0)
## fastmap 1.1.0 2021-01-25 [1] CRAN (R 4.1.0)
## forcats * 0.5.1 2021-01-27 [1] CRAN (R 4.1.0)
## fs 1.5.0 2020-07-31 [1] CRAN (R 4.1.0)
## generics 0.1.0 2020-10-31 [1] CRAN (R 4.1.0)
## ggplot2 * 3.3.5 2021-06-25 [1] CRAN (R 4.1.0)
## ggrepel 0.9.1 2021-01-15 [1] CRAN (R 4.1.0)
## glue 1.4.2 2020-08-27 [1] CRAN (R 4.1.0)
## gtable 0.3.0 2019-03-25 [1] CRAN (R 4.1.0)
## haven 2.4.3 2021-08-04 [1] CRAN (R 4.1.0)
## highr 0.9 2021-04-16 [1] CRAN (R 4.1.0)
## hms 1.1.0 2021-05-17 [1] CRAN (R 4.1.0)
## htmltools 0.5.2 2021-08-25 [1] CRAN (R 4.1.0)
## httr 1.4.2 2020-07-20 [1] CRAN (R 4.1.0)
## jquerylib 0.1.4 2021-04-26 [1] CRAN (R 4.1.0)
## jsonlite 1.7.2 2020-12-09 [1] CRAN (R 4.1.0)
## knitr 1.34 2021-09-09 [1] CRAN (R 4.1.0)
## labeling 0.4.2 2020-10-20 [1] CRAN (R 4.1.0)
## lifecycle 1.0.1 2021-09-24 [1] CRAN (R 4.1.1)
## lubridate * 1.7.10 2021-02-26 [1] CRAN (R 4.1.0)
## magrittr 2.0.1 2020-11-17 [1] CRAN (R 4.1.0)
## memoise 2.0.0 2021-01-26 [1] CRAN (R 4.1.0)
## modelr 0.1.8 2020-05-19 [1] CRAN (R 4.1.0)
## munsell 0.5.0 2018-06-12 [1] CRAN (R 4.1.0)
## pillar 1.6.2 2021-07-29 [1] CRAN (R 4.1.0)
## pkgbuild 1.2.0 2020-12-15 [1] CRAN (R 4.1.0)
## pkgconfig 2.0.3 2019-09-22 [1] CRAN (R 4.1.0)
## pkgload 1.2.2 2021-09-11 [1] CRAN (R 4.1.0)
## plotrix * 3.8-2 2021-09-08 [1] CRAN (R 4.1.0)
## prettyunits 1.1.1 2020-01-24 [1] CRAN (R 4.1.0)
## processx 3.5.2 2021-04-30 [1] CRAN (R 4.1.0)
## ps 1.6.0 2021-02-28 [1] CRAN (R 4.1.0)
## purrr * 0.3.4 2020-04-17 [1] CRAN (R 4.1.0)
## R6 2.5.1 2021-08-19 [1] CRAN (R 4.1.0)
## Rcpp 1.0.7 2021-07-07 [1] CRAN (R 4.1.0)
## readr * 2.0.1 2021-08-10 [1] CRAN (R 4.1.0)
## readxl 1.3.1 2019-03-13 [1] CRAN (R 4.1.0)
## remotes 2.4.0 2021-06-02 [1] CRAN (R 4.1.0)
## reprex 2.0.1 2021-08-05 [1] CRAN (R 4.1.0)
## rlang 0.4.11 2021-04-30 [1] CRAN (R 4.1.0)
## rmarkdown 2.11 2021-09-14 [1] CRAN (R 4.1.0)
## rprojroot 2.0.2 2020-11-15 [1] CRAN (R 4.1.0)
## rstudioapi 0.13 2020-11-12 [1] CRAN (R 4.1.0)
## rvest 1.0.1 2021-07-26 [1] CRAN (R 4.1.0)
## sass 0.4.0 2021-05-12 [1] CRAN (R 4.1.0)
## scales 1.1.1 2020-05-11 [1] CRAN (R 4.1.0)
## sessioninfo 1.1.1 2018-11-05 [1] CRAN (R 4.1.0)
## stringi 1.7.4 2021-08-25 [1] CRAN (R 4.1.0)
## stringr * 1.4.0 2019-02-10 [1] CRAN (R 4.1.0)
## testthat 3.0.4 2021-07-01 [1] CRAN (R 4.1.0)
## tibble * 3.1.4 2021-08-25 [1] CRAN (R 4.1.0)
## tidyr * 1.1.3 2021-03-03 [1] CRAN (R 4.1.0)
## tidyselect 1.1.1 2021-04-30 [1] CRAN (R 4.1.0)
## tidyverse * 1.3.1 2021-04-15 [1] CRAN (R 4.1.0)
## tzdb 0.1.2 2021-07-20 [1] CRAN (R 4.1.0)
## usethis 2.0.1 2021-02-10 [1] CRAN (R 4.1.0)
## utf8 1.2.2 2021-07-24 [1] CRAN (R 4.1.0)
## vctrs 0.3.8 2021-04-29 [1] CRAN (R 4.1.0)
## vroom 1.5.5 2021-09-14 [1] CRAN (R 4.1.0)
## withr 2.4.2 2021-04-18 [1] CRAN (R 4.1.0)
## xfun 0.26 2021-09-14 [1] CRAN (R 4.1.0)
## xml2 1.3.2 2020-04-23 [1] CRAN (R 4.1.0)
## yaml 2.2.1 2020-02-01 [1] CRAN (R 4.1.0)
##
## [1] /Library/Frameworks/R.framework/Versions/4.1/Resources/library