I have written another blogpost about Looking beyond accuracy to improve trust in machine learning at my company codecentric’s blog:
Traditional machine learning workflows focus heavily on model training and optimization; the best model is usually chosen via performance measures like accuracy or error and we tend to assume that a model is good enough for deployment if it passes certain thresholds of these performance criteria. Why a model makes the predictions it makes, however, is generally neglected.
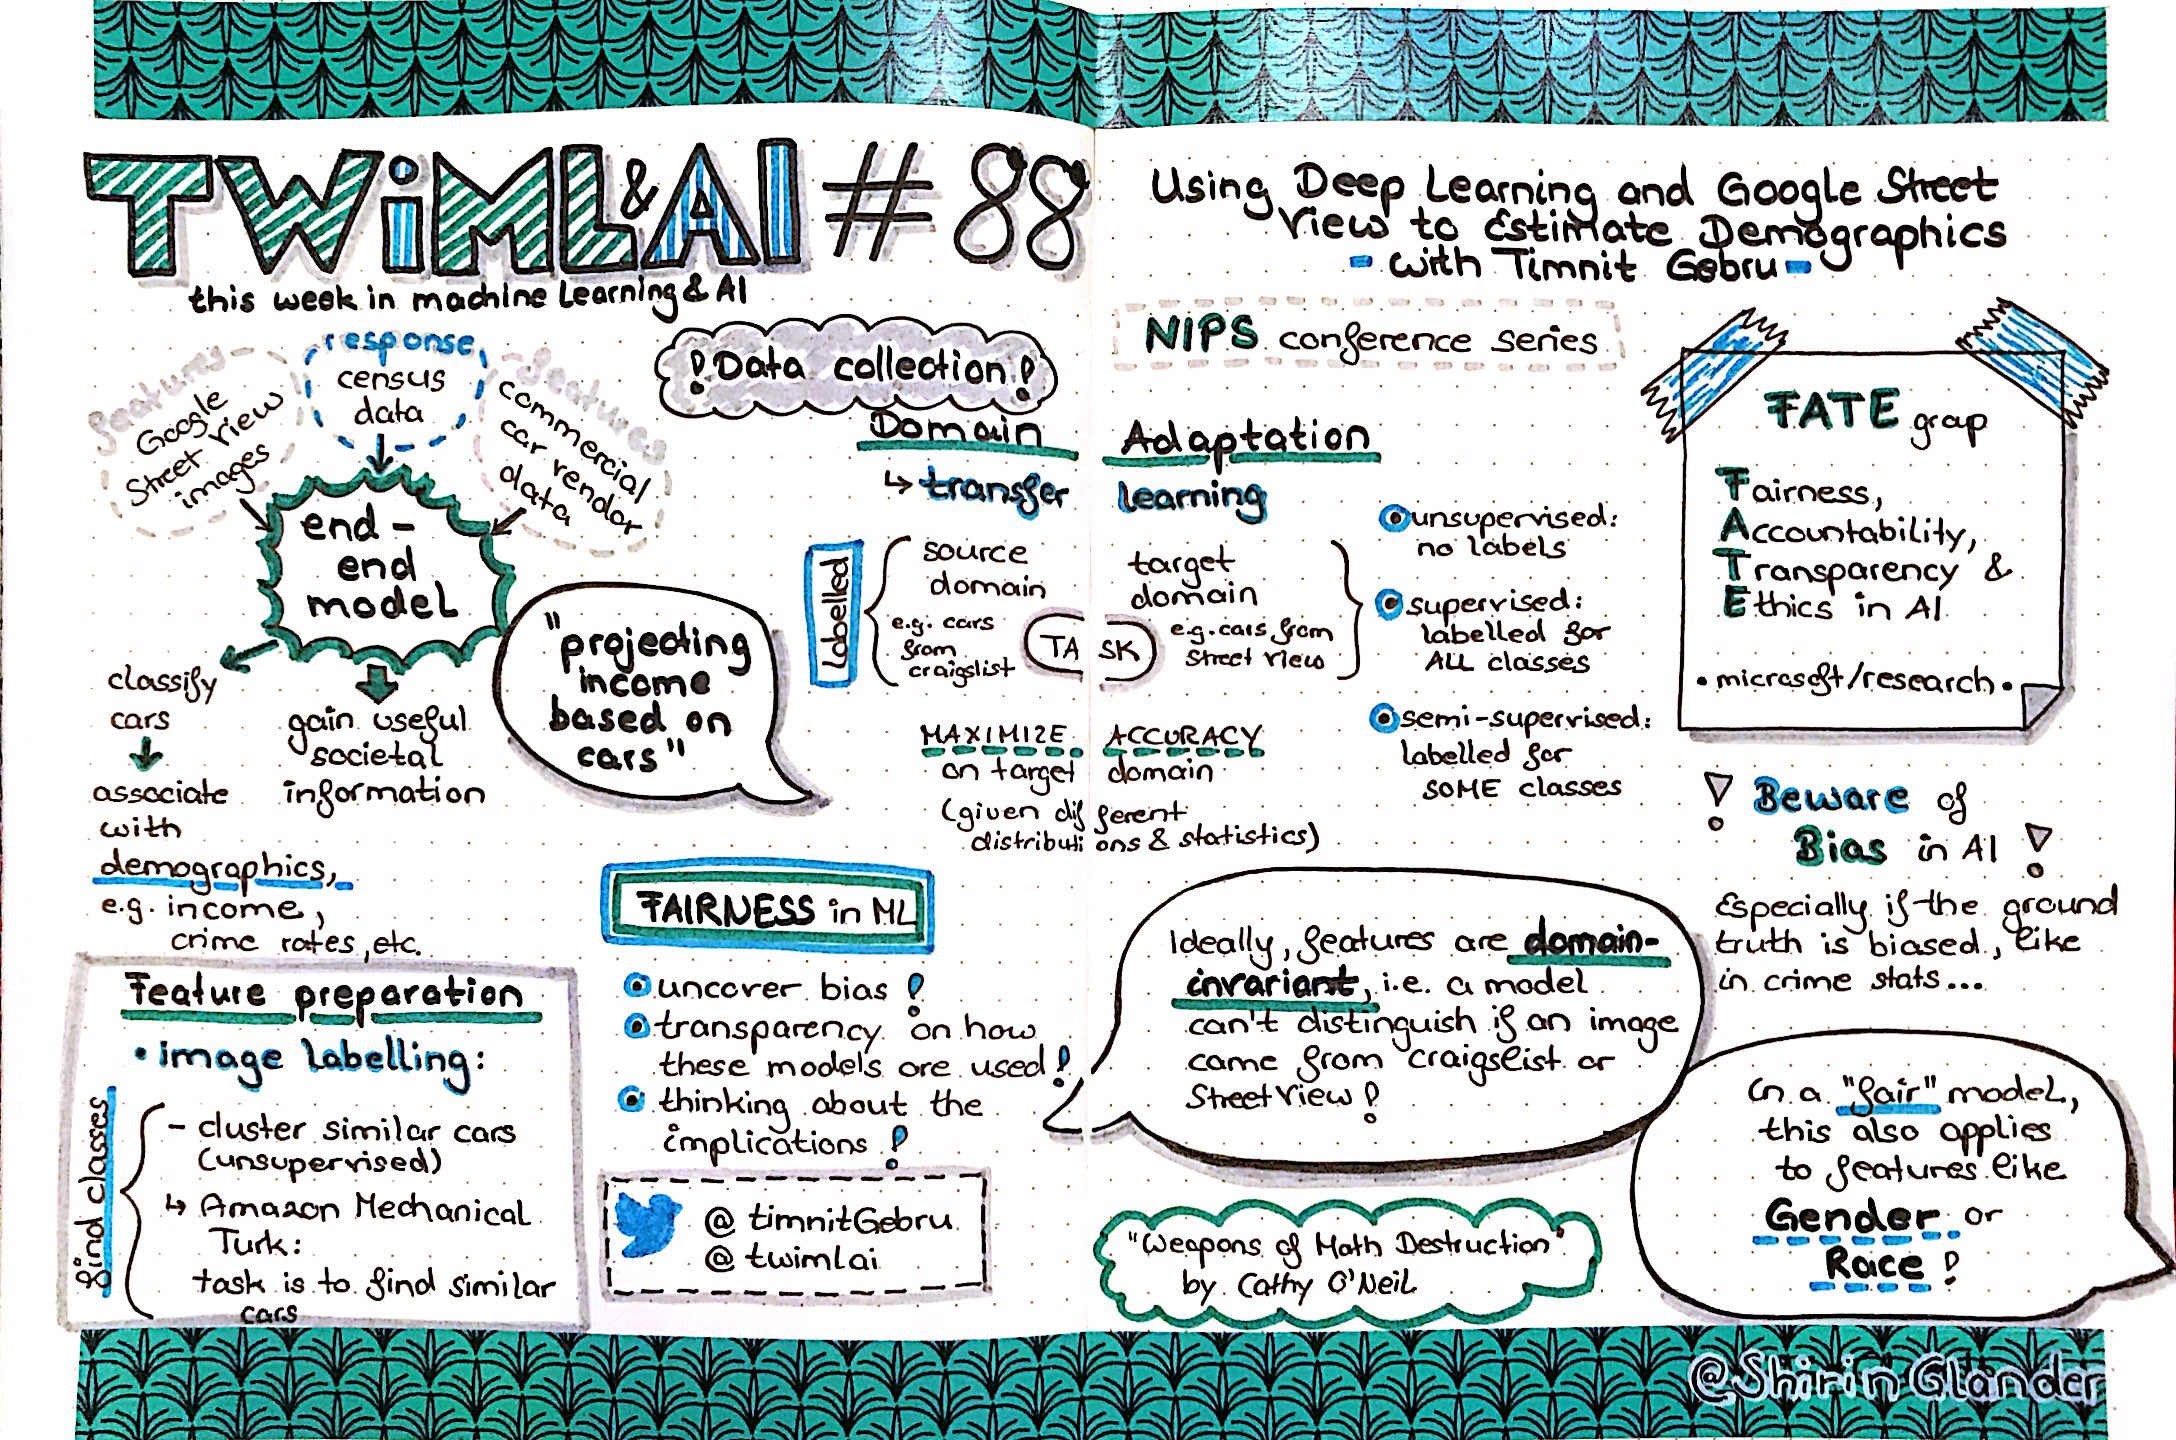
These are my sketchnotes taken from the “This week in Machine Learning & AI” podcast number 88 about Using Deep Learning and Google Street View to Estimate Demographics with Timnit Gebru:
Sketchnotes from TWiMLAI talk #88: Using Deep Learning and Google Street View to Estimate Demographics with Timnit Gebru
Recently, I announced my workshop on Deep Learning with Keras and TensorFlow.
The next dates for it are January 18th and 19th in Solingen, Germany.
You can register now by following this link: https://www.codecentric.de/schulung/deep-learning-mit-keras-und-tensorflow
If any non-German-speaking people want to attend, I’m happy to give the course in English!
Contact me if you have further questions.
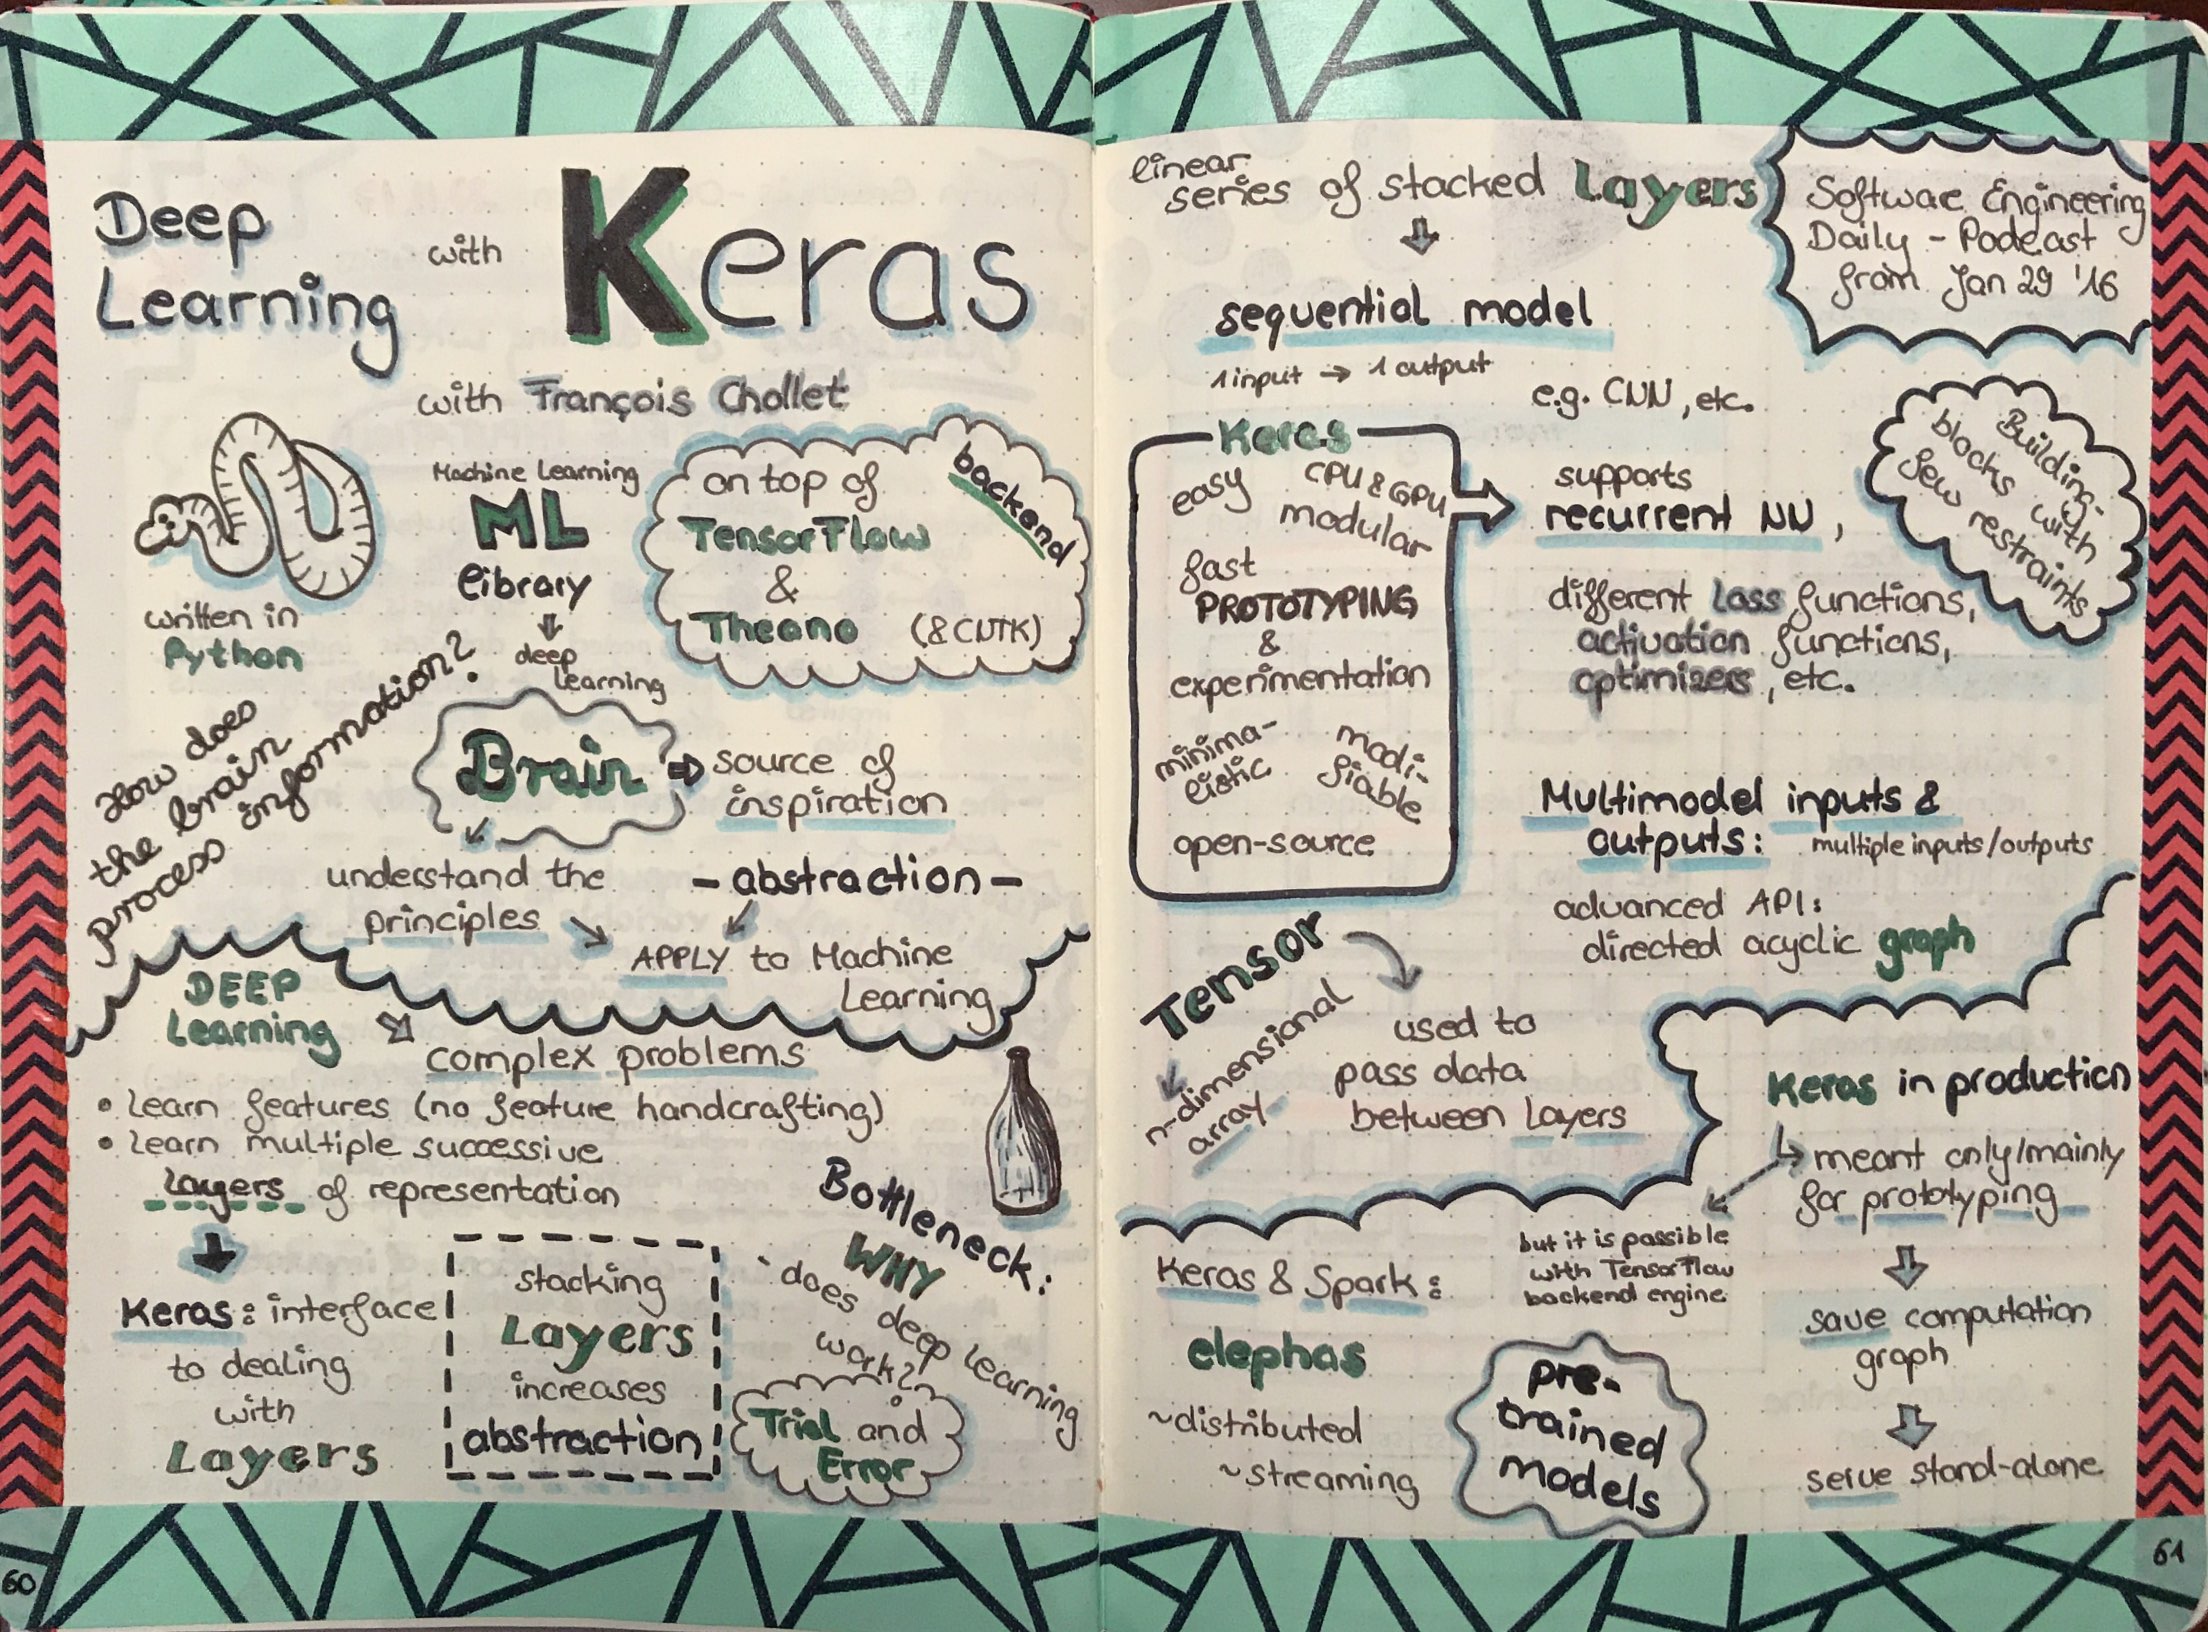
As a little bonus, I am also sharing my sketch notes from a Podcast I listened to when first getting into Keras:
Slides from Münster Data Science Meetup These are my slides from the Münster Data Science Meetup on December 12th, 2017.
knitr::include_url("https://shiring.github.io/netlify_images/lime_meetup_slides_wvsh6s.pdf")
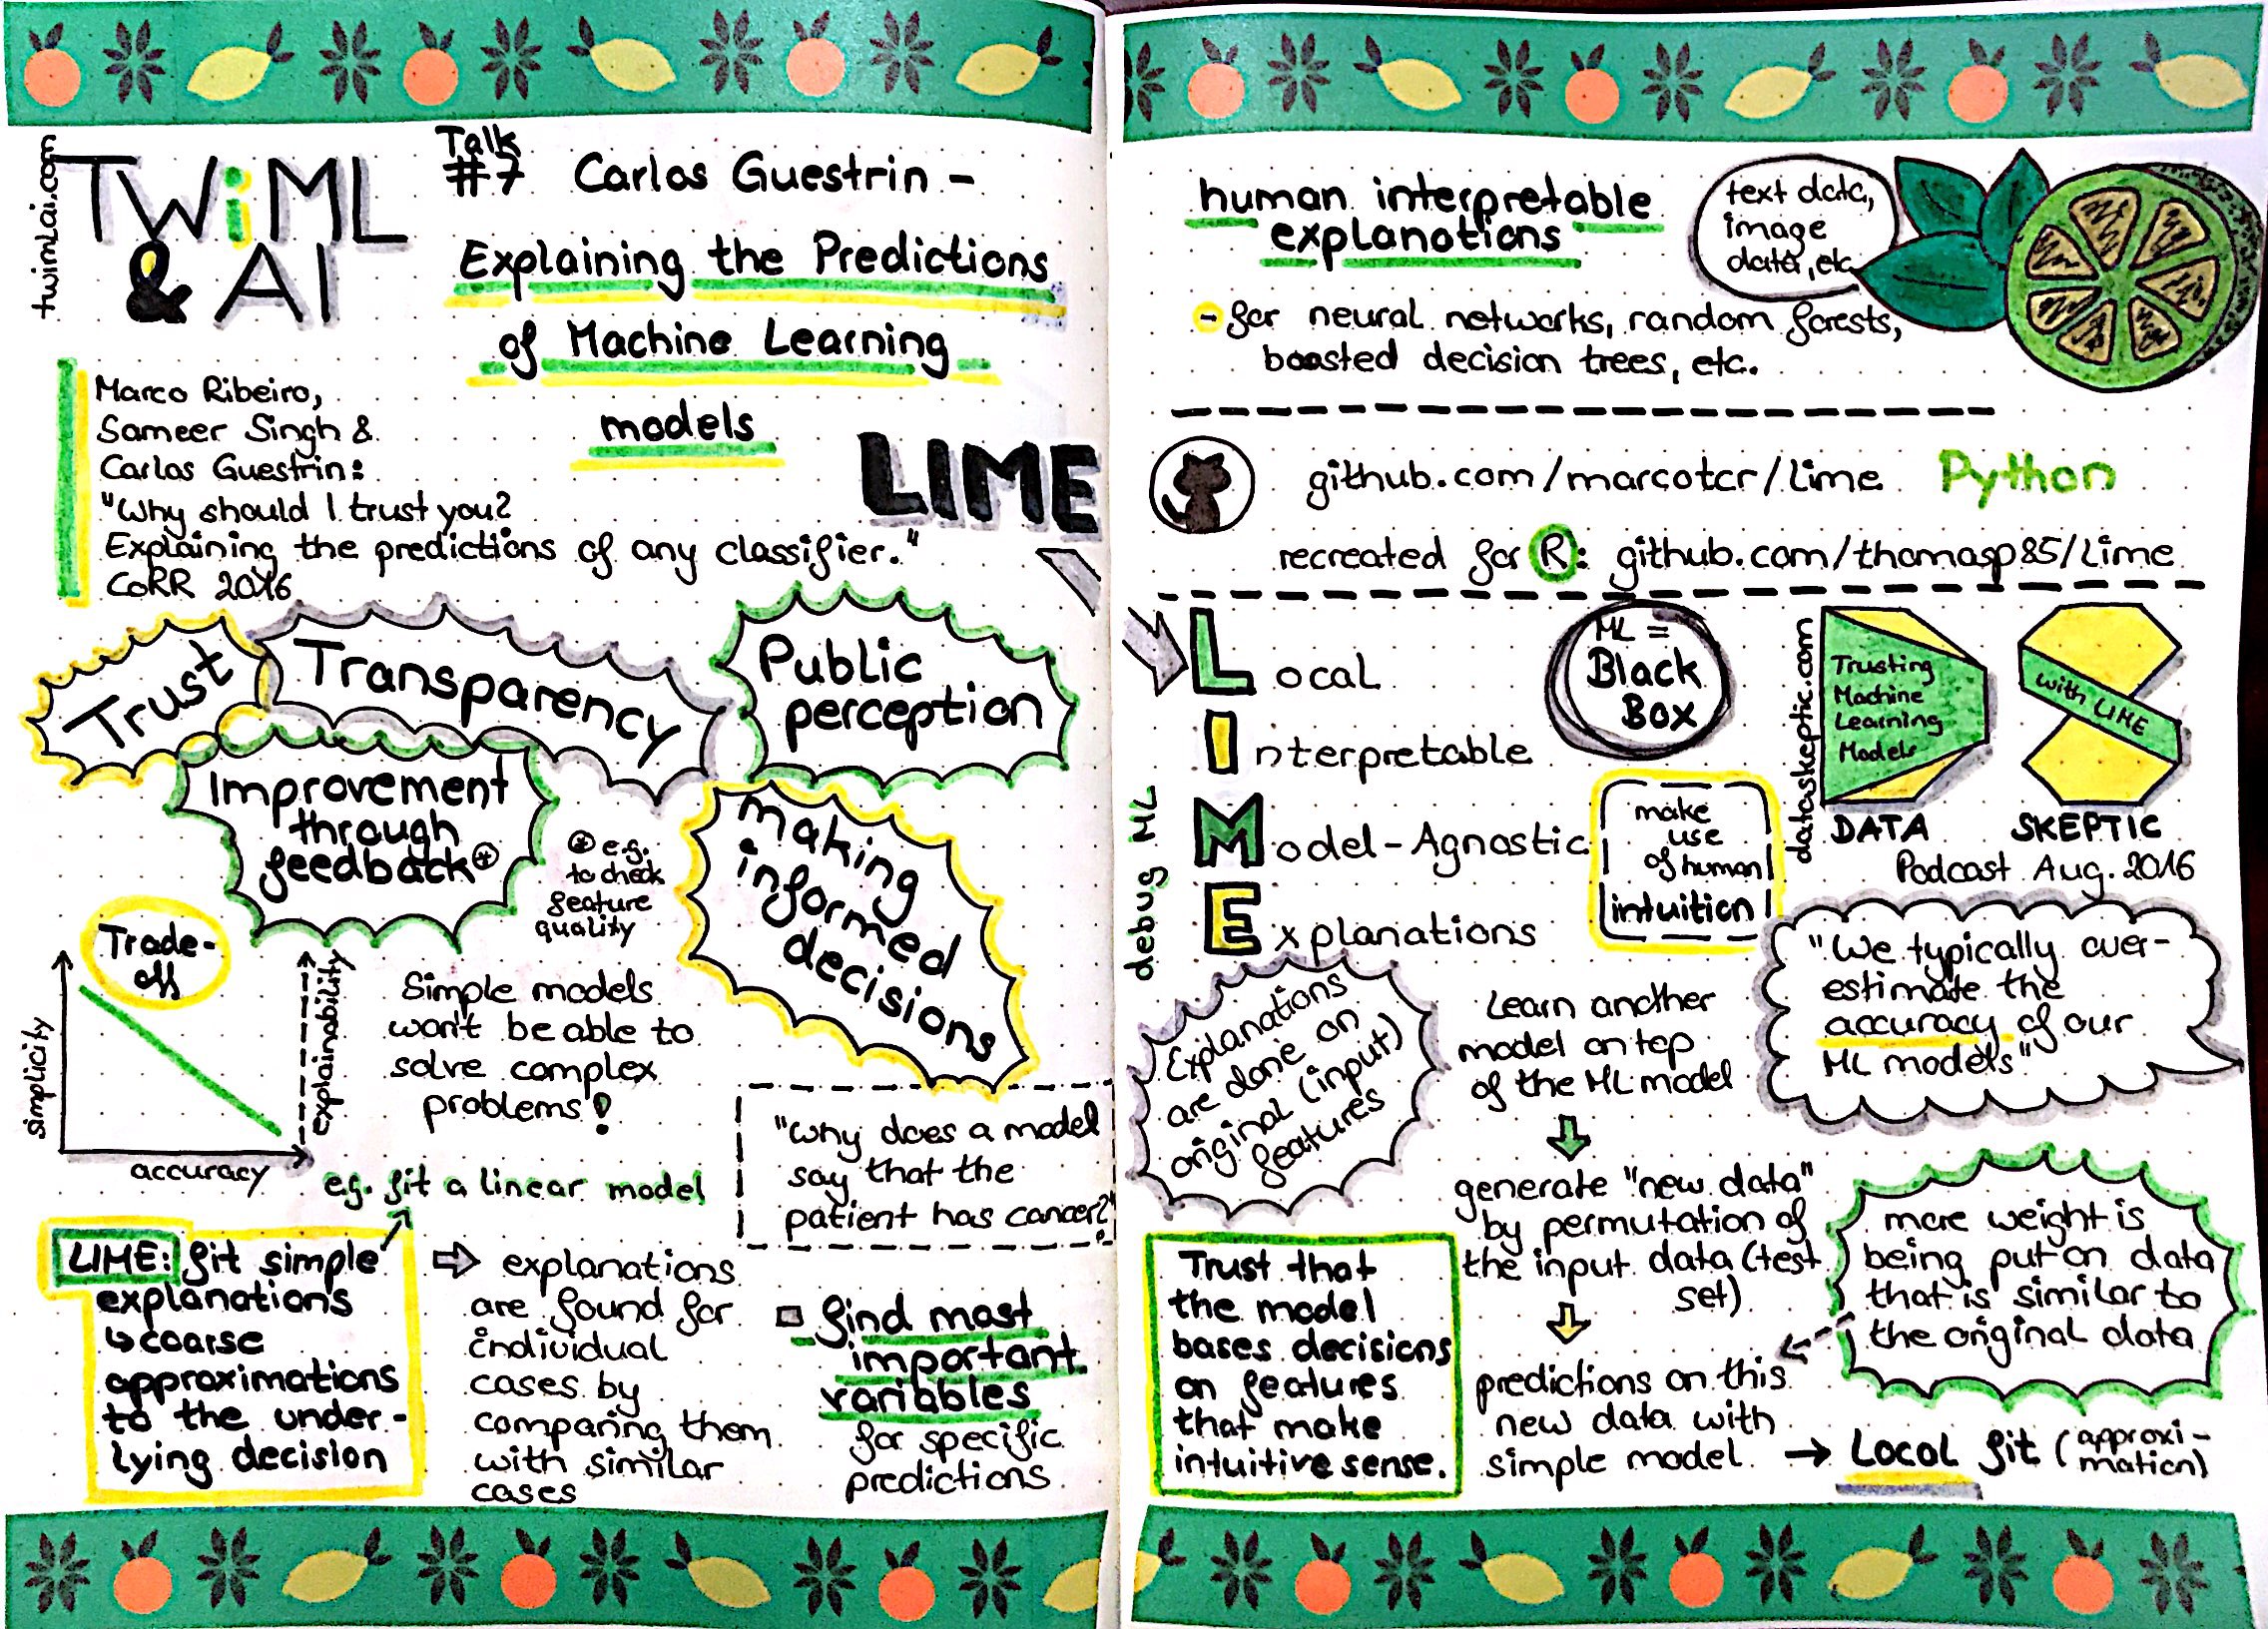
My sketchnotes were collected from these two podcasts:
https://twimlai.com/twiml-talk-7-carlos-guestrin-explaining-predictions-machine-learning-models/ https://dataskeptic.com/blog/episodes/2016/trusting-machine-learning-models-with-lime Sketchnotes: TWiML Talk #7 with Carlos Guestrin – Explaining the Predictions of Machine Learning Models & Data Skeptic Podcast - Trusting Machine Learning Models with Lime
Example Code the following libraries were loaded: library(tidyverse) # for tidy data analysis library(farff) # for reading arff file library(missForest) # for imputing missing values library(dummies) # for creating dummy variables library(caret) # for modeling library(lime) # for explaining predictions Data The Chronic Kidney Disease dataset was downloaded from UC Irvine’s Machine Learning repository: http://archive.
Last night, the MünsteR R user-group had another great meetup:
Karin Groothuis-Oudshoorn, Assistant Professor at the University of Twente, presented her R package mice about Multivariate Imputation by Chained Equations.
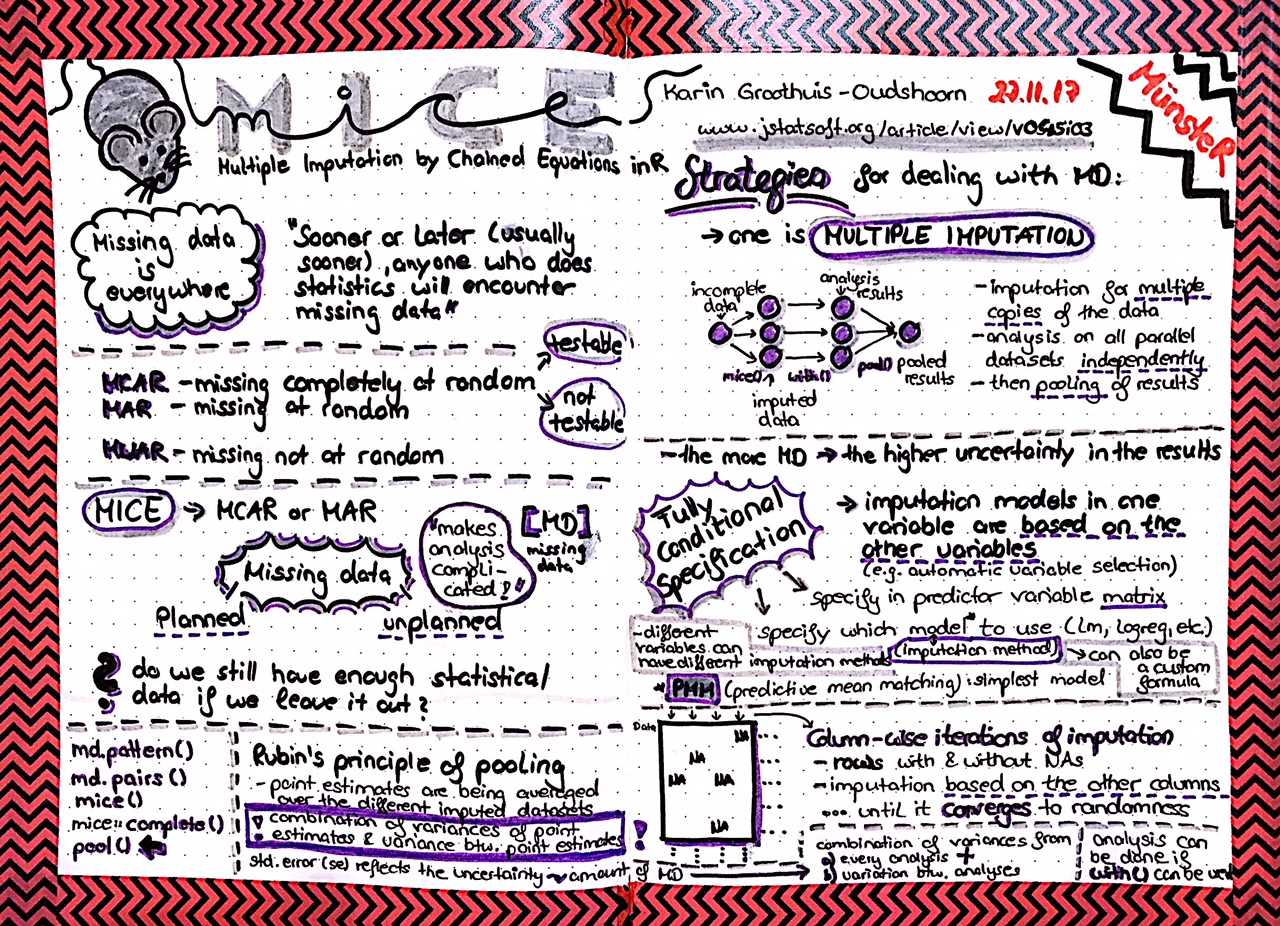
It was a very interesting talk and here are my sketchnotes that I took during it:
MICE talk sketchnotes
Here is the link to the paper referenced in my notes: https://www.jstatsoft.org/article/view/v045i03
“The mice package implements a method to deal with missing data.
You can now book me and my 1-day workshop on deep learning with Keras and TensorFlow using R.
In my workshop, you will learn
the basics of deep learning what cross-entropy and loss is about activation functions how to optimize weights and biases with backpropagation and gradient descent how to build (deep) neural networks with Keras and TensorFlow how to save and load models and model weights how to visualize models with TensorBoard how to make predictions on test data Date and place depend on who and how many people are interested, so please contact me either directly or via the workshop page: https://www.
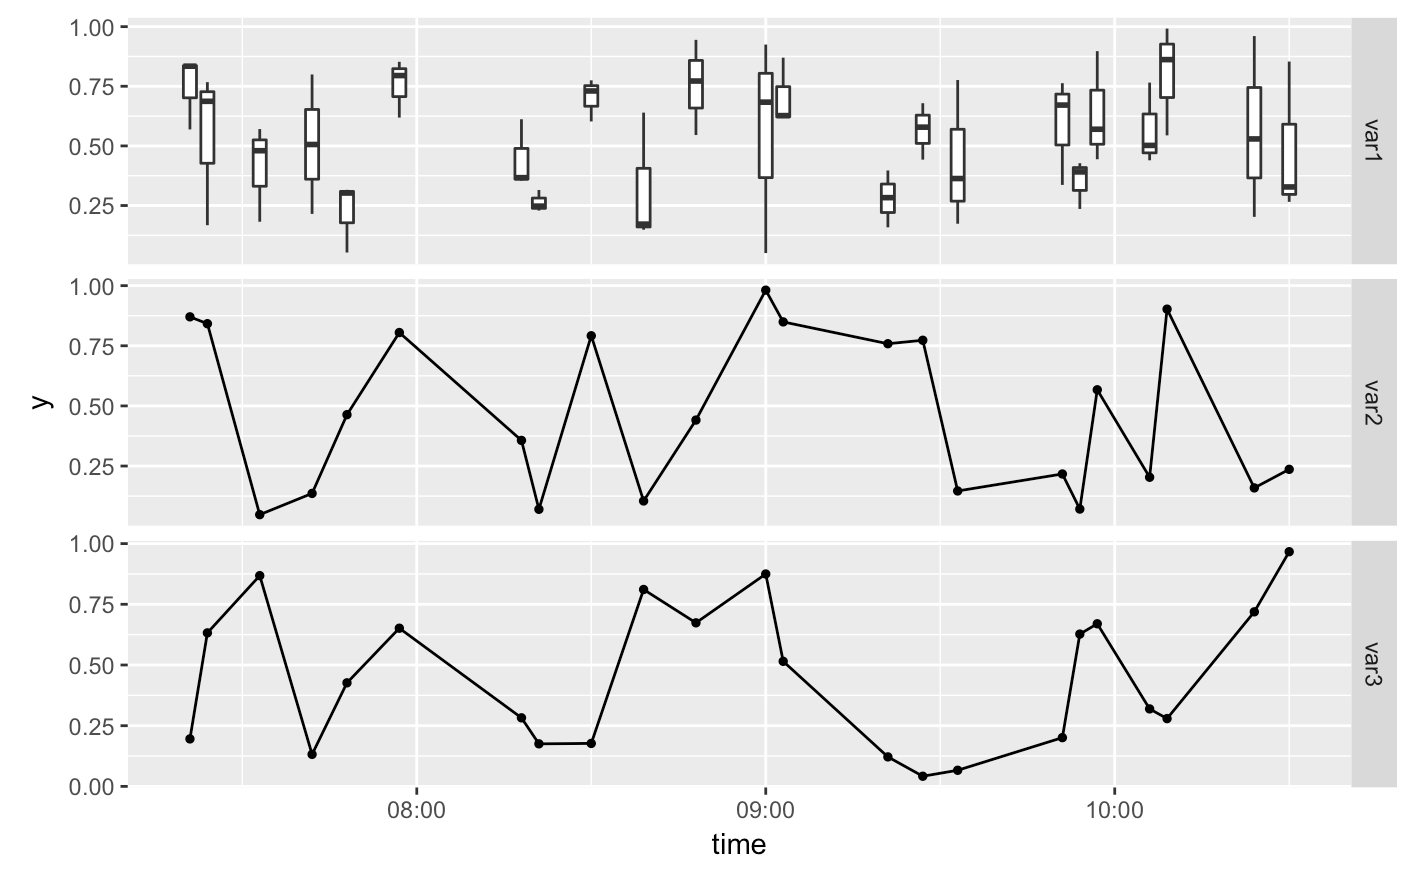
In a recent project, I was looking to plot data from different variables along the same time axis. The difficulty was, that some of these variables I wanted to have as point plots, while others I wanted as box-plots.
Because I work with the tidyverse, I wanted to produce these plots with ggplot2. Faceting was the obvious first step but it took me quite a while to figure out how to best combine facets with point plots (where I have one value per time point) with and box-plots (where I have multiple values per time point).