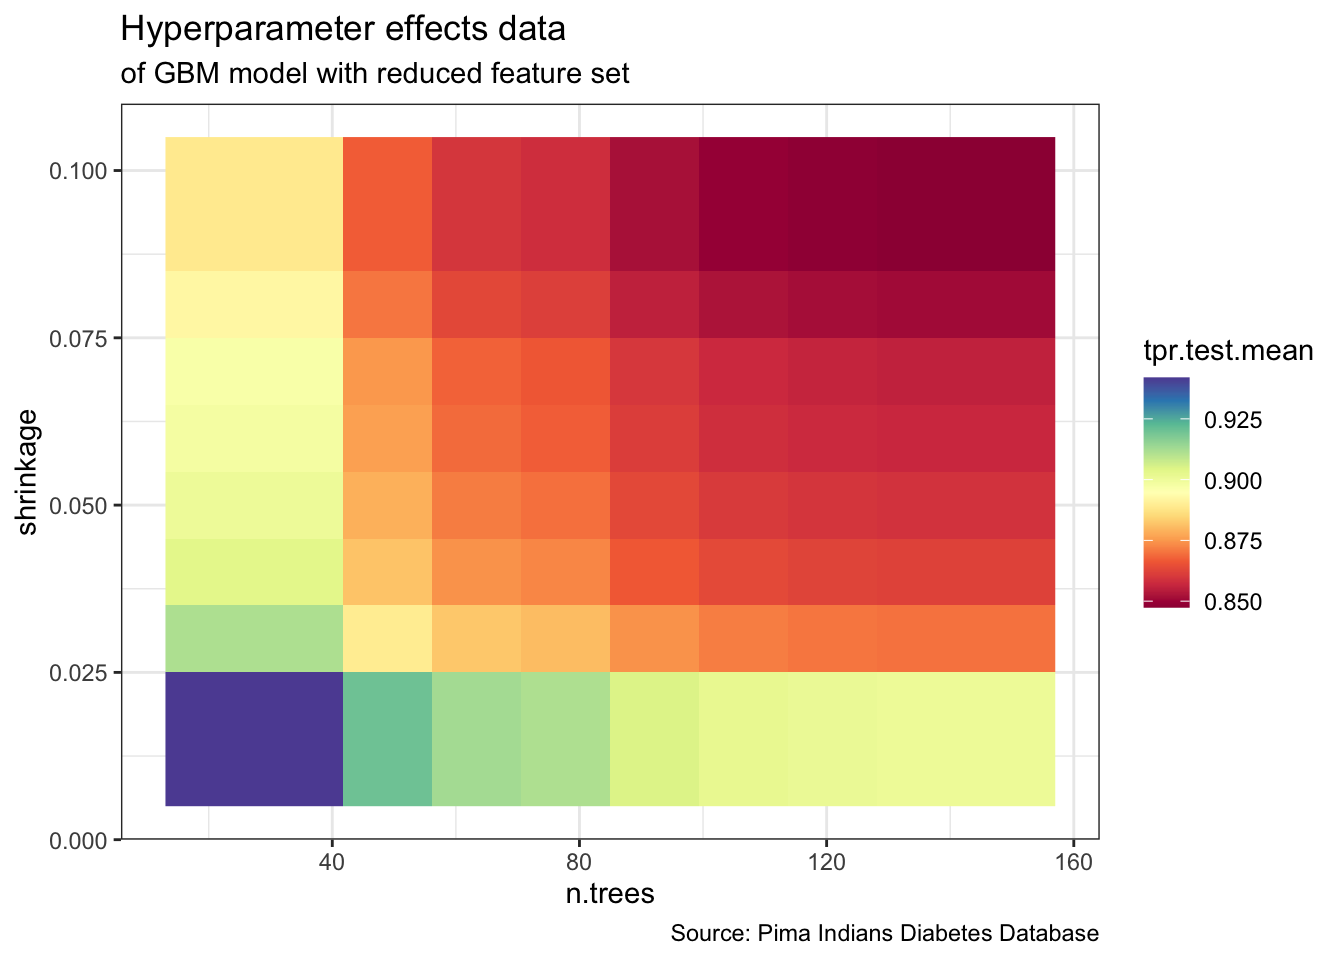
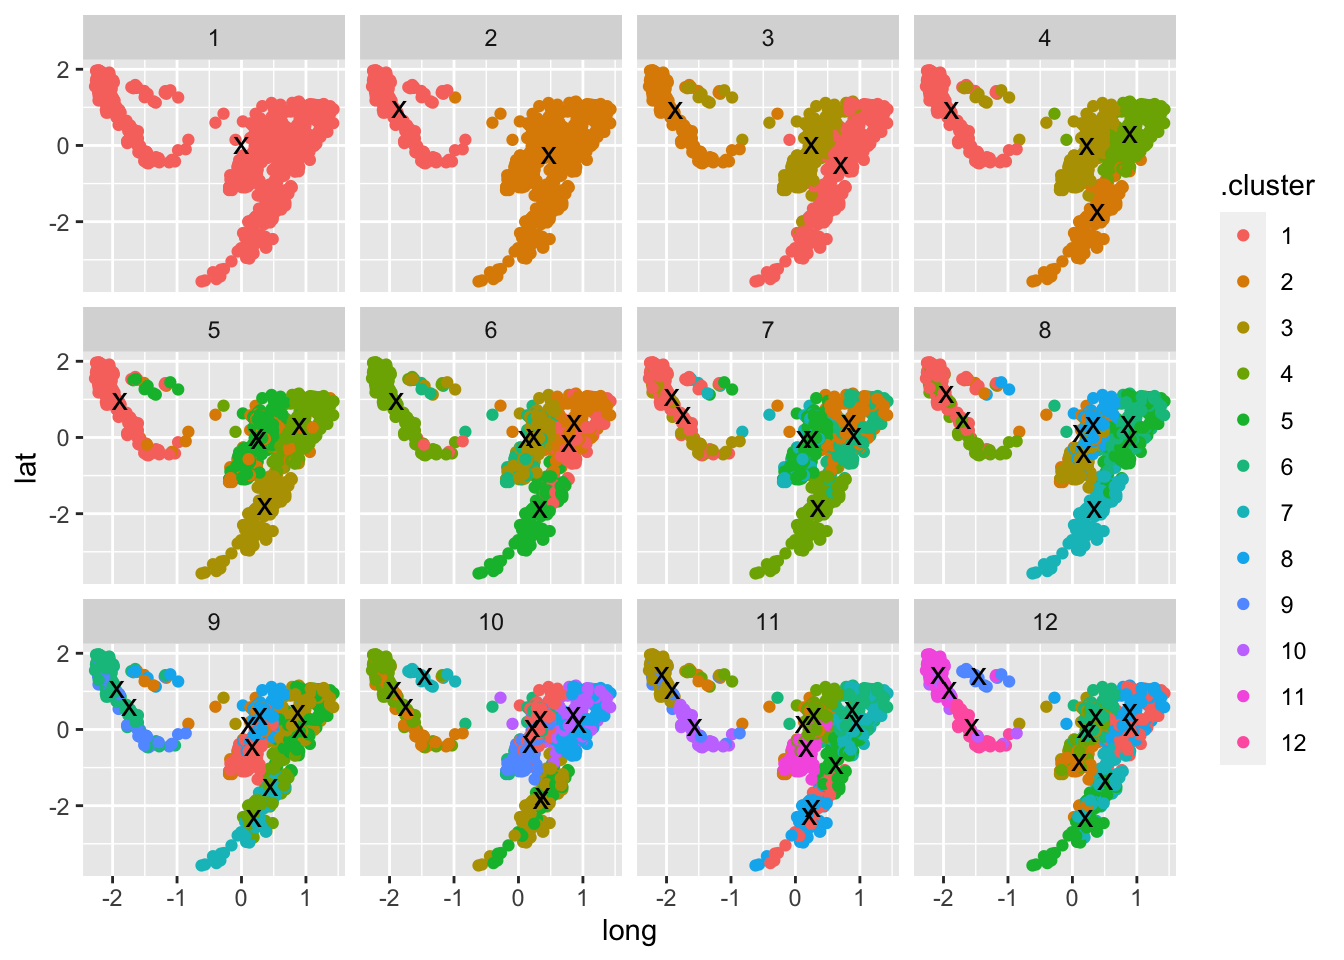
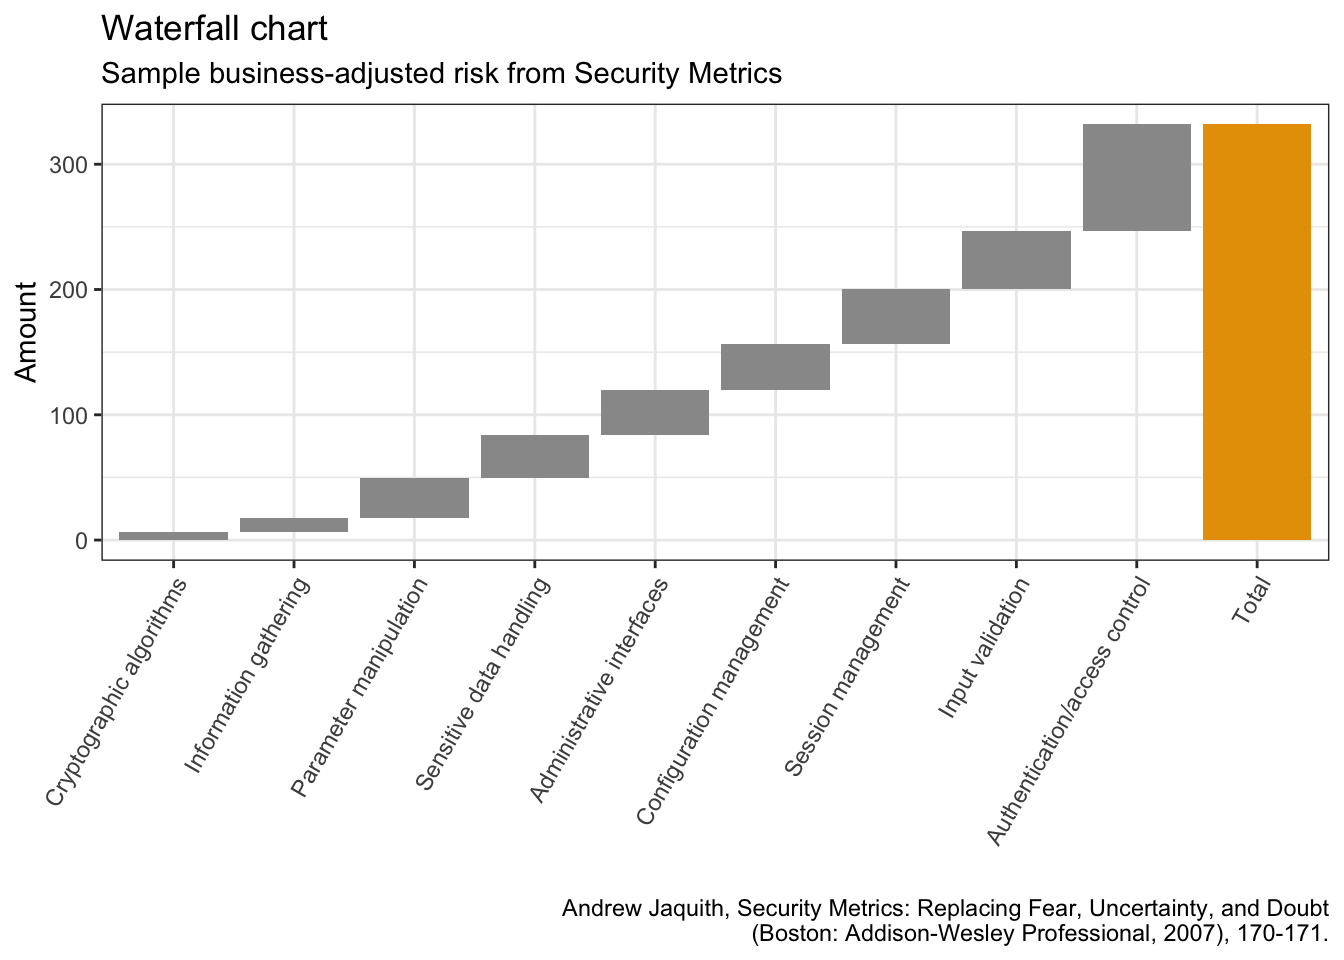
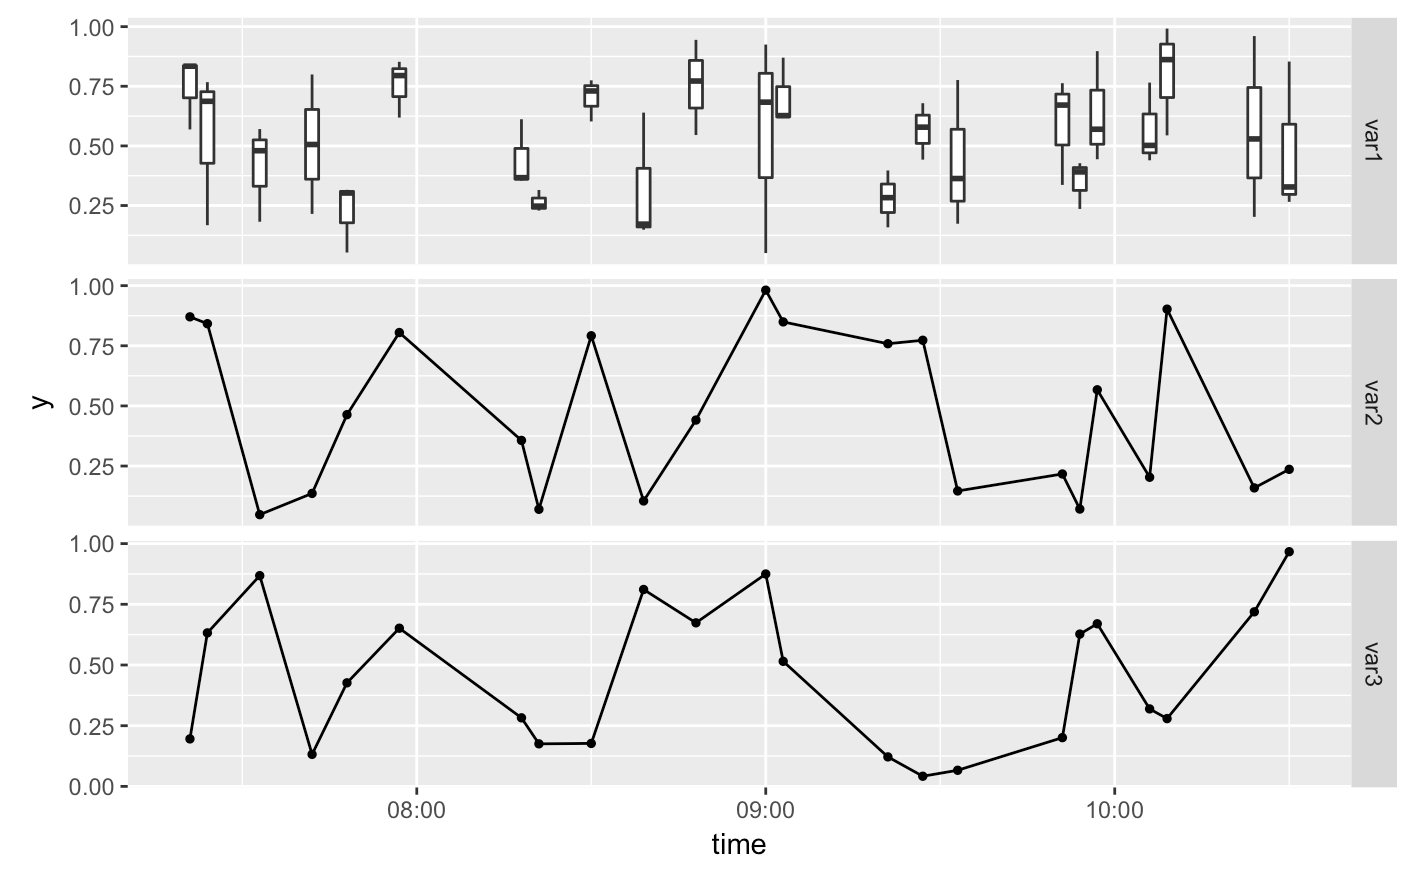
Below you’ll find the complete code and resources used to create the graphs in my talk The Good, the Bad and the Ugly: how to visualize Machine Learning data at this year’s Minds Mastering machines conference. You can find the German slides here:
You can find Part 1: The Good, the Bad and the Ugly: how (not) to visualize data here.
If you have questions or would like to talk about this article (or something else data-related), you can now book 15-minute timeslots with me (it’s free - one slot available per weekday):